Welcome to my Trading Blog

Disclaimer: This is my personal Blog, reflecting my very own views on Forex , shares and commodity tradings. As such, all informations provided here are barely for information purposes only,. The author should not be held liable for any errors, incomplete information, delayed messages, or for any actions taken in reliance on information contained herein.This blog is new, being established on 06,May.2010. While I am executing trades, posting will be sent simultaneously. The date/Time indicated here is of US Pacific zone(++15 Hours for Singapore/KL/Beijing, Or ++7 hours GMT)

Monday, February 28, 2011

Euro/Usd--- Latest update on trading ideas

Daily Euro/Usd Chart

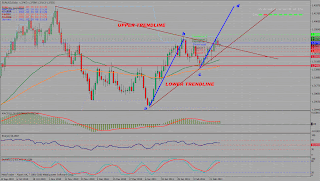
looking at the above daily chart, we do observe that the range between 1.3860 and 1.3716 holds for the past few trading sessions.  and the LOWER Trendline is also very close to the 1.3700 till the NFP  on this coming Friday's Release. I do predict that Euro/Usd will trade within this range for the next 2-3 days, before any decisive movement beyond this range can be effected.

Please do refer to my last posting below on the Euro/Usd Trading ideas


I repeat that a decisive breaking the upper range level at 1.3860 shall drive this currency pair beyond 1.4000 near terms

A poor NFP report will accelerate the bullish momentum with target close to 1.4200 areas. Likewise, any positive news from Euro Unions this week will see this currency pair being lifted beyond 1.4200.

Sunday, February 27, 2011

Euros/Usd ---will it go beyond 1.4000 near term ??

Higher Oil price due to unstable oil producing nations in East-North Africa and Saudis  is worrying. The budding improvement in the US recovery may be seriously curtailed, and may be wiped out completely. This may result in the introducing of possible QE 3 in the US.Any economic contraction would least favor the U.S. consumer and discourage the Fed from changing its policy mix.


ECB will convene a meeting on March 3, and  Officials have sounded increasingly hawkish in recent weeks. That rhetoric is likely to translate into action. It may put the market on notice by acknowledging it no longer forecasts inflation to fall back below the 2% level this year.  The talk on the possibility of Interest rise cannot be ignored.
Over the past week alone, the German 2-year yield rose more than 20 bp as the market priced less accommodative conditions


Germany, with France’s support, has put forward a number of proposals to enhance euro zone competitiveness and the POLITICAL implication has a higher effect on Euros Strength which will be visible in the various Euros zone meetings in March.
it is likely Portugal will become the third member to seek an assistance package. The relaxed terms that will be given to Greece and Ireland will be given to Portugal. and recently sentiments towards Spain has improved, All in all, the Sentiments on Euros has vastly improved.


On March 4, if The Non-Farm Payroll data is deteriorating, then it may reflect the poor recovery in the US economies, and the OE3 possibility may be enhanced.  And Then we may have a Political Storm over the approaching federal debt ceiling IN THE NEXT UPCOMING WEEKS.


Summing up, The Euros strength is positively biased near term Fundamentally.


Daily EURO/USD Chart


H4 euros/usd chart


From Daily chart above, we envisage that the completion of ab-cd  pattern may see the PA near 1.4100-1.4200. The current Bullish momentum is still intact. 1.3700 is a strong support, and the daily chart strong Resistance is near zone  1.3820-1.3860.Breaking this resistance areas may see 1.4100 level and beyond.,  please observe both the Upper and lower trend lines on the Daily Chart.


On both the H1/H4 charts, bullish momentum is still intact.


Overall trend on the Euros/Usd is Bullish Technically 


Swiss Franc---the King of fx ---will usd/chf heading below 0.9000 near term ??

The Swiss economy appears fairly resilient in the face of the strength of the Swiss franc.
The Swiss Franc clearly benefited from its position as a safe haven and that is the clearest indication of world unrest.
Fundamentally, we expect continuous strengthening of Swiss Franc near term AT TARGET NEAR 0.9000 in the midst of weakening Dollars and unstable Euros.


Weekly Usd/Chf Chart


Daily Usd/Chf Chart


From the Weekly Chart, the completion of ab-cd pattern may see 0.9150-0.9200 . And please do note that the swing low/high on the weekly chart indicate that 1.2700  Fibo extension is also near 0.9200 areas.
Right now the PA has entered a territory of multi-months Low, and the Risk aversion activities may acccelerate the declination toward the psychological level near 0.9000.


The weekly pivot is now at 0.9300 and the weekly resistance is near 0.9450 (R1).WHICH SHALL SERVE AS A STRONG RESISTANCE LEVELS.

Gbp/Usd-- to continue its Bullishness beyond 1.6500 ??

The pressure to tighten the monetary policy is increasing on the BOE.
MPC minutes revealed a third call for a rate rise  responding to a fourteenth consecutive monthly breach of the Bank’s 2% inflation target. The downgrade to growth in today’s revised report alleviated some of that pressure as investors pondered the importance of growth over inflation as the key catalyst
The Bank of England WILL AGAIN meet on March 10.Although sterling is not always driven by economic data, given the range of opinion on the MPC, in the weeks ahead it might be more sensitive to  data. The slow down data in fourth Quarter may stop  the rise of Sterling temporarily.
But the factor on the possible interest rate  revision from BOE cannot be discarded near term


H4 Gbp/Usd Chart


Weekly Gbp/Usd Chart


Basing on the Weekly Chart, the pivot is 1.6140, and S1 and S2 are 1.6000 and 1.5890 respectively. The R1 and R2 are 1.6250 and 1.6385 respectively.
Currently, the Bullish momentum is still intact. as shown in the upper trend line support. As the Sterling is extremely sensitive to economic data, (see above comments), we have to watch this currency pair carefully in the next 24 hours as reflected in the Risk aversion plays.
A decisive break above 1.6350 may see 1.6500 which is the psychological level.
However, a break below 1.5890 may confirm Bearish reversal.
I would recommend to long Gbp/usd prior to market opening on Monday Morning

Usd/Cad--will it go below 0.9500 near term ??

The excessive high price of the oil  provides a tonic for the strengthening of Canadian dollars.
The Canadian dollar might have found further strength  as pre-market stock index futures staged a health rebound after two days of heavy selling last Friday.
Generally, Canadian Dollars is in better shape as compared to US dollars, even though the  
rising oil prices will depress global growth and especially so given the nation’s reliance on the U.S. consumer


Weekly USD/CAD CHART


 Weekly Usd/Cad Chart


Daily USD/CAD Chart


Looking at both the weekly charts above, you may observe that the the formation of extreme bearish Butterfly pattern, with bearish momentum targeted at 0.9708 (First Target), follows by 0.9051(Second target), being the multi-month low target.
The weekly S1 and S2 are 0.9720 and 0.9660 respectively, And the R1 and R2 being 0.9900 and 1.0000 respectively, with Pivot be 0.9840(Weekly)


The Usd/Cad pair is now in very bearish momentum  heading towards 0.9000 multi-months low


Tuesday, February 22, 2011

Tomorrow Wednesday Top Economic News Release affectiog Gbp and Dollars

1.0)  GBP- Bank of England Monetary Policy Committee Meeting Minutes


Wed., Feb. 23, 4:30 am, ET. 


high inflation and the threat of economic slowdown as a result of the U.K. government’s massive spending cuts create a difficult situation for the Bank of England policy makers.  But we expect that the  interest rate shall be maintained.
However, if more policy makers have joined the camp of the two “rate hawks” Andrew Sentance and Martin Weale, the market could continue to price expectations for an interest rate increase in the near future. 


We suspect the odds favor some near term disappointment and thus a GBP pullback unless the other UK events mentioned below or overall risk appetite spur new optimism and keep rate hike hopes elevated.


2.0) USD- U.S. Existing Home Sales,


Wed., Feb. 23, 10:00 am, ET. 


the main gauge of the condition of the U.S. housing market measuring the number of closed sales of previously constructed homes, condominiums and co-ops . the sales of existing homes could also inch higher to 5.3 M in January from 5.28 M in December. 


For the past week the EURUSD trend was higher despite all the bad EUR news (the pair followed falling USD short term rates relative to those of the EUR traders, so assume more uptrend and that traders should do the opposite in the near term and go long the above instruments until we see evidence of a trend reversal lower for the EUR. Binary option traders maintain bias to calls on the EUR pairs and EU stocks and indexes until we see evidence of a trend change.


Sunday, February 20, 2011

Top economic news today affecting FX trading (EUR)

This event will affect the movement of Euros crosses


Germany IFO Institute Business Climate and Expectations Index,
and Euro-zone Composite Manufacturing and Services PMI- Purchasing Managers Indexes,


Time:  Mon., Feb. 21, 4:00 am, ET. 


Germany IFO index is expected to maintain the Bullish outlook with a reading of 110.2 in February, compared with 110.3 in the previous month.
The Euro-zone Composite PMI could demonstrate strength in the Euro-zone economy with the index rising to 56.9 in February from 56.3 in January. 


Do watch out for the actual release numbers TODAY

Euro/Usd ---heading beyond 1.3800 near term ??

The announcement from Fed  that the economy was getting slight improvement  but mentioned that in order to recover lost employment might take five or six years. As a result there was no adjustment on  its second wave of quantitative easing. and if we look at the Dollars index, it dipped below 77.68 on last Friday close and it may plunge below 76.85 with its bearish momentum near term..
And there was no major negative news on Euros comparatively.


The sentiments on EUROS/ USD is slightly Bullish -biased.


H4 EU Chart


H1 buttery pattern with Ichimoku Chart


Basing on the H4 chart, we can see that further lifting above wave tip" e" is predictable, and the Double Top may be sighted near areas 1.3715-1.3800. However, a convincing lift beyond it (1.3715) may result in 1.3800--1.4000 being breached.


On the H1 chart with Butterfly pattern , we can predict a lift in the 1.3800 areas with a slight bullish sentiments in upcoming trading days, and it may reverse and heading down South near its lifting near  1.3800 areas too.


Trading Strategy


Trade with caution with smaller lot size on LONG Euro/Usd initially,, and watching out areas near 1.3800-1.4000 which will provide a golden opportunity to Short all the way till 1.3536.

GBP/USD --will it breach beyond 1.6500 ???

All Investors have been looking  for signs that the (BOE)Bank of England would soon raise interest rates. Inflation rose to twice its permitted ceiling LAST WEEK.
In an unexpected twist to finish the week weather-weary consumers drove retail sales back from the winter doldrums to the strongest advance since February 2010. While sales excluding cars and fuel surged by 1.6% and far faster than a 0.5% forecast,
And  investors began to sense that there may be room for monetary tightening after all. 

Hawkish comments by MPC member Andrew Sentance, and further fueled by 
 Rumors that MPC member Bean may become the third hawk on the committee.


GPB/USD daily with Ichimoku Chart


GBP/USD Weekly Chart


Looking at the Daily Chart, the ‘buy zone  near 1.6100-1.6200 that suggests strong momentum for more upside. While there is real near term resistance ahead at the prior top from November around the 1.6300 zone, a look at the weekly CHART  above  reveals that if the cable can clear the 1.6300 resistance area it has room to run up to the 1.6530 areas, and after that up to the 1.6847 zone.

USD/CHF--- will it go below 0.9200 near term ??

Investors view Swiss Franc  as a darling safe heaven currency which is   further enhanced by the problems  and weaknesses  on both  the Dollars and Yen . and we predict that Usd/Chf may breach 0.9200 near term.

Daily Usd/Chf  with ab-cd Chart


Daily Usd/Chf  with Ichimoku Chart


 On the above Chart, we can derive that the strong bearish momentum shall drive this currency pair towards its recent low near 0.9298, (completion of ab-cd pattern),  and breaching  its all time low below 0.9200 cannot be discarded if the Dollars weakness persists near term.

GBP/JPY--- star of FX is in the making?? --towards 145.00 ??

In view of the impending strengthening of GBP and the  weakening of YEN due to its bearish fundamentals, we reckon that GBP/JPY can be the out-performing currency pair near term.

Weekly GBP/JPY chart 


Weekly GBP/JPY chart(Enlarged)


Technically, GBP/JPY has breached its resistance near  135.10 on Weekly chart above, , and the strong bullish momentum shall lift this currency pair above 138.42( the 38.2% Fibo Retr), and then sighting the level 141.14 (23.6% Fibo Retr) and beyond.
 The possibility of  lifting from 141.14 to 145.00 cannot be totally discarded.