The currency pair EURO/USD has just breached 1.2271 high minutes ago, and it shall be the best opportunity to SELL down down the pair..(GMT 12:50,,US PACIFIC 05:50)
If you are following my Blog, and you may refer now to my Postings on EURO/USD last Saturday/Sunday. I mentioned on the importance of Sell down on Recovery , as this pair is slightly bullish only on near term, but on longer term , this pair is still extremely Bearish.
If you refer to the Daily Chart A below, you too can see that this pair is registering a series of lower highs and lower lows, indicating that the price action is still in BEARISH zone.
You may use M5, M30, H1 ,H4 charts with all your favorite indicators to spot the resistance level from which the price action reverses its course resulting in many opportunity to sell down, ,
DO remember, SELL DOWN ON RECOVERY....
Happy trading
This blog will detail how to create unlimited wealth through Forex/Futures/Commodity and Option Trading
Welcome to my Trading Blog
Disclaimer: This is my personal Blog, reflecting my very own views on Forex , shares and commodity tradings. As such, all informations provided here are barely for information purposes only,. The author should not be held liable for any errors, incomplete information, delayed messages, or for any actions taken in reliance on information contained herein.This blog is new, being established on 06,May.2010. While I am executing trades, posting will be sent simultaneously. The date/Time indicated here is of US Pacific zone(++15 Hours for Singapore/KL/Beijing, Or ++7 hours GMT)
Monday, June 14, 2010
USD/CHF - ANOTHER GOLDEN OPPORTUNITY ??
The Currency pair USD/CHF has been drifted down last week from 1.1600 to 1.1430 and closed higher low at 1.1491 on Friday.
Right now it is traded toward South at 1.1360 with high acceleration, and the level at 1.1234 may be violated soon (1.1234 is the 0.382 Fibo Retr. Level as shown in the below chart. A), Breaking the support at 1.1234 exposes 1.0929
The updated Chart B with Guppy trend lines below confirm the Bearish descent....
GMT 11:55 Mon,; US PACIFIC 04:55 Mon,; KL/SINGAPORE/BEIJING 19:55 Mon
Your SELL DOWN the pair should bear good fruits....
Chart A
Chart B
HAPPY TRADING..
Right now it is traded toward South at 1.1360 with high acceleration, and the level at 1.1234 may be violated soon (1.1234 is the 0.382 Fibo Retr. Level as shown in the below chart. A), Breaking the support at 1.1234 exposes 1.0929
The updated Chart B with Guppy trend lines below confirm the Bearish descent....
GMT 11:55 Mon,; US PACIFIC 04:55 Mon,; KL/SINGAPORE/BEIJING 19:55 Mon
Your SELL DOWN the pair should bear good fruits....
Chart A
Chart B
HAPPY TRADING..
Sunday, June 13, 2010
AUD/USD ---A potential GOOD trade set up is in the MAKING ??
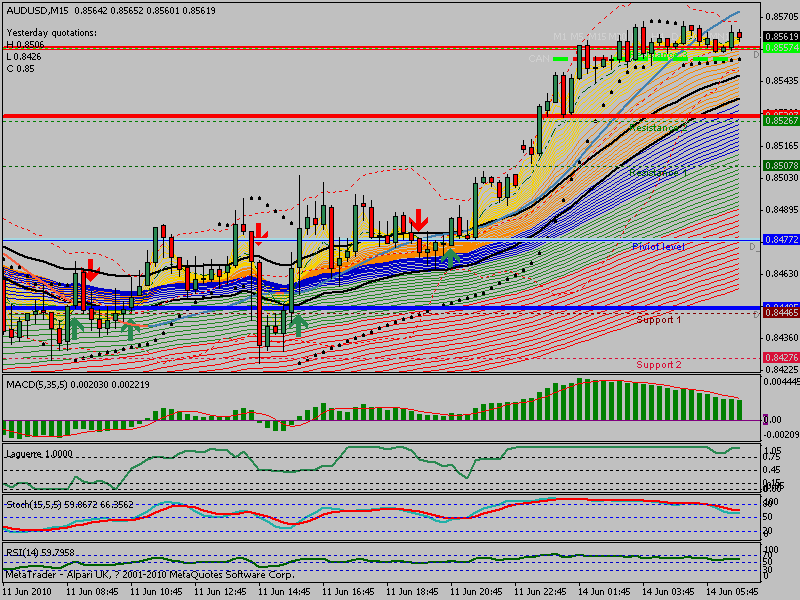
Do observe the below Chart, there is a beautiful DOUBLE Bottom Formation since 07 May,2010 till now.
The 38.2% Retr. Fibo Level is at 0.8572. ,,AND 0.8582 IS THE IMMEDIATE RESISTANCE,
So Traders be alert now, and be patient to wait for the next price action !!
NOTE:The currency pair AUD/USD is now traded at 0.8554 (GMT02:05 Mon;;,KL/SINGAPORE/BEIJING 10:05 Mon ;;, US PACIFIC 19:05,or 07:05 p.m.Sun )with Bullish divergence.
WAIT FOR THE NEXT PRICE ACTION NEAR THE ABOVE LEVELS BEFORE YOU EXECUTE YOUR TRADES ACCORDINGLY......
Shooting Star.after breaking 0.8570-0.8580................... Probability=80%
Falling like a stone from cliff near/from the above levels.. Probability=20%
HAPPY TRADING .......
Latest Updated Price chart with Guppy Trend Lines on AUD/USD(M15),,:GMT 05:00 Mon,,:: US PACIFIC 22:00 Sun,::,KL/ Singapore/ Beijing 13:00 Mon)-
The 38.2% Retr. Fibo Level is at 0.8572. ,,AND 0.8582 IS THE IMMEDIATE RESISTANCE,
So Traders be alert now, and be patient to wait for the next price action !!
NOTE:The currency pair AUD/USD is now traded at 0.8554 (GMT02:05 Mon;;,KL/SINGAPORE/BEIJING 10:05 Mon ;;, US PACIFIC 19:05,or 07:05 p.m.Sun )with Bullish divergence.
WAIT FOR THE NEXT PRICE ACTION NEAR THE ABOVE LEVELS BEFORE YOU EXECUTE YOUR TRADES ACCORDINGLY......
Shooting Star.after breaking 0.8570-0.8580................... Probability=80%
Falling like a stone from cliff near/from the above levels.. Probability=20%
HAPPY TRADING .......
Latest Updated Price chart with Guppy Trend Lines on AUD/USD(M15),,:GMT 05:00 Mon,,:: US PACIFIC 22:00 Sun,::,KL/ Singapore/ Beijing 13:00 Mon)-
GBP/JPY---A potential excellent Trade Opportunity ??
Looking at the below Chart, we expect a strong RALLY for the currency pair GBP/JPY toward the 138.62 (61.8% FIBO Retr. Level) with a bullish divergence. You should be in the Buying position for the Currency pair near terms.
There may be a Major MOVE near the 138.62,and it may be another Golden Opportunity to SELL the pair then.....
,,.But be patient and act ONLY basing on Actual Price Movements....., NO ACTION BASING ON PREDICTION SOLELY......
Happy Trading......
Updated chart for GBP/JPY with Guppy trend lines as below:-(M 15)
:GMT 05:00 Mon,,:: US PACIFIC 22:00 Sun,::,KL/ Singapore/ Beijing 13:00 Mon)-
Happy Trading....
There may be a Major MOVE near the 138.62,and it may be another Golden Opportunity to SELL the pair then.....
,,.But be patient and act ONLY basing on Actual Price Movements....., NO ACTION BASING ON PREDICTION SOLELY......
Happy Trading......
Updated chart for GBP/JPY with Guppy trend lines as below:-(M 15)
:GMT 05:00 Mon,,:: US PACIFIC 22:00 Sun,::,KL/ Singapore/ Beijing 13:00 Mon)-
Happy Trading....
OUTLOOK ON USD/MYR ---Below 3.1000 is imminent ??
Both the short and mid term view on MYR is very Bullish against the USD , Further pending on the release of Malaysia's favorable Forecast on Positive GDP numbers and Growth rate in the incoming second quarter, fueled with possible revision on its interest rate again in July, the price action for currency pair USD/MYR may plunge through the recent Low at 3.1180, with immediate target at 3.1000.
The Hourly Chart shows the extreme Bearishness, and the nose-diving action toward the 3.1000 level is rather rapid.
The Technicals on Daily Chart below is also confirming the Bearish trend with an imminent level at 3.1000 on sight soon.
How to Make Your First Million from Forex Trading.....Part 1 of 10 is here...
I am NOW giving you some simple tips on ways to be a millionaire FROM Forex Trading. This is the part 1 in serial of 10 as listed below :--
To create a successful trading strategy, traders should address the following considerations:
1. Reasoning of the trade: Why buy or sell? Which pair?
2. Timing of the trade: Why now? Before economic news releases or after? Day or night?
3. Trading objective: What is the take profit target? What is the stop loss?How do you determine ?
4. Money management.
5. Documentation and analysis of the results.
Please go to this link to get more explanation and elaborations on the above Five (5)sub-headings :-
http://docs.google.com/fileview?id=0B74IMi--bRpKOTZmNDEyNjMtNjdmYi00NGFhLTk2NzEtMjg
3Y2JkOWQ3NDZk&hl=en
And go to this link to view an example of TRADER Trading Log...
http://docs.google.com/fileview?id=0B74IMi--bRpKY2QxOTE4YzctZjgxOS00OTRhLTkwYjAtNzcwNDFmNmFiMWUx&hl=en
Please follow up on my Part 2 in this series............
HAPPY TRADING...
One of the most common mistakes new Forex traders do, is that they have no trading strategy. Because of the many appealing characteristics (24 hours, trade both short and long, leverage etc) most of the new traders entering the market are eager to prove themselves in an often egoistic approach. Egoistic in that they believe that they can become very profitable and make a fortune in the short term, but soon enough they end up with a bad psychology which at the end accelerates their loosing pattern. In fact, the most successful Forex traders are people recognized for their humility and discipline , humbleness and trading within their means, patience and calmness.... These qualities are acquired through experience and accepting some simple realities of the Forex market.
The first step towards becoming profitable in the Forex market is to devise a trading strategy/plan. Creating a trading strategy is of paramount importance and is actually very easy.
To create a successful trading strategy, traders should address the following considerations:
1. Reasoning of the trade: Why buy or sell? Which pair?2. Timing of the trade: Why now? Before economic news releases or after? Day or night?
3. Trading objective: What is the take profit target? What is the stop loss?How do you determine ?
4. Money management.
5. Documentation and analysis of the results.
Please go to this link to get more explanation and elaborations on the above Five (5)sub-headings :-
http://docs.google.com/fileview?id=0B74IMi--bRpKOTZmNDEyNjMtNjdmYi00NGFhLTk2NzEtMjg
3Y2JkOWQ3NDZk&hl=en
And go to this link to view an example of TRADER Trading Log...
http://docs.google.com/fileview?id=0B74IMi--bRpKY2QxOTE4YzctZjgxOS00OTRhLTkwYjAtNzcwNDFmNmFiMWUx&hl=en
Please follow up on my Part 2 in this series............
HAPPY TRADING...
Saturday, June 12, 2010
Trading Strategy on EURO/USD for Upcoming week, TO Augment my last posting on the currency pair outlook
My view on the EURO/USD next week will be slightly on the POSITIVE biased short terms and the Currency remains Bearish for Mid / Long terms.
I would like to use the GUPPY trend lines for various EMA to illustrate and augment my view on the above.
From the Chart A of M5 as listed below, you too can observe that both the Yellow and Orange Short term Trend lines oscillated between both the Green and Red Longer terms Trend lines ,,indicating a slight Positively Biased Trend, and also the price action did demonstrate the resilience of the Euro . at least seemed to be on Short term basis..
From the same Chart A, you can Spot Three Good Trade Set- ups , labelled as Sell Trade A, Sell Trade B, and Buy Trade C.
If you look at Chart B of H4,, You too can observe that the Short terms and longer terms Trend lines and are in proper sequential Order, and you can derive the VIEW THAT the currency pair EURO/USD shall remain in the Bearish Zone for an extended period.
So the Strategy for the coming week for EURO/USD shall be SELL ON RECOVERY near the resistance 1.2200, as illustrated in my previous Post on the same topic.
CHART A of M5
CHART B of H4
HAPPY TRADING...
FOOT NOTE: I have just added the following two books for your reading.. Do find them from my FREE DOWNLOAD LINKS:-
1) How to make a living by trading STOCKS
2)Futures and Options --- How to Trade
I would like to use the GUPPY trend lines for various EMA to illustrate and augment my view on the above.
From the Chart A of M5 as listed below, you too can observe that both the Yellow and Orange Short term Trend lines oscillated between both the Green and Red Longer terms Trend lines ,,indicating a slight Positively Biased Trend, and also the price action did demonstrate the resilience of the Euro . at least seemed to be on Short term basis..
From the same Chart A, you can Spot Three Good Trade Set- ups , labelled as Sell Trade A, Sell Trade B, and Buy Trade C.
If you look at Chart B of H4,, You too can observe that the Short terms and longer terms Trend lines and are in proper sequential Order, and you can derive the VIEW THAT the currency pair EURO/USD shall remain in the Bearish Zone for an extended period.
So the Strategy for the coming week for EURO/USD shall be SELL ON RECOVERY near the resistance 1.2200, as illustrated in my previous Post on the same topic.
CHART A of M5
CHART B of H4
HAPPY TRADING...
FOOT NOTE: I have just added the following two books for your reading.. Do find them from my FREE DOWNLOAD LINKS:-
1) How to make a living by trading STOCKS
2)Futures and Options --- How to Trade
OUTLOOK ON EURO/USD, Will it Decline Further ??
The steady recovery of DJ/ S & P 500 LAST WEEK have temporarily relieve the heavy Selling pressure on Euros, fueled by both BOE and ECB holding back their Bank's interest revision. However, the statements from ECB chiefs on the possibility of Further topping up the 750B Euros Rescue Fund may cool down the current mild Reversal .
We do observe that Euro showed its resilience by breaking the Upper Resistance trend lines (hitting at 1.2153 highest.),, as indicated on both the below Chart A and Chart B., and if you look carefully over the Elliot Wave chart D, labelled V(1), it shows the recent rebound is rather weak, and the overall outlook for the EURO/USD is still very bearish and the downtrend may persist for a few weeks.
The present wave V may propel the pair slightly higher in the week ahead,, pushing it near the next immediate resistance at 1.2216 before resuming its decline and downtrend .
On Chart C , The Candle stick and Ichimoku Indicates that a break below 1.2074 (previous resistance) is needed to signal a top has possibly been formed and extend fall to the Ichimoku cloud top (now at 1.2035), break there would bring test of the lower Kumo (now at 1.1995), however, only below 1.1957 support would confirm correction from 1.1876 is over and bring resumption of downtrend next week.
So in a nutshell, the outlook for EURO/USD will be still bearish next week, , the currency pair may have mild reversal up to the next resistace level 1.2216 before resuming its downward trend,,, breaking below1.1957 will expose next low toward 1.1860(recent low)
So SELL ON RECOVERY ( Near 1.2200) is proposed for week ahead
Chart A
Chart B
Chart C
Chart D
HAPPY TRADING
We do observe that Euro showed its resilience by breaking the Upper Resistance trend lines (hitting at 1.2153 highest.),, as indicated on both the below Chart A and Chart B., and if you look carefully over the Elliot Wave chart D, labelled V(1), it shows the recent rebound is rather weak, and the overall outlook for the EURO/USD is still very bearish and the downtrend may persist for a few weeks.
The present wave V may propel the pair slightly higher in the week ahead,, pushing it near the next immediate resistance at 1.2216 before resuming its decline and downtrend .
On Chart C , The Candle stick and Ichimoku Indicates that a break below 1.2074 (previous resistance) is needed to signal a top has possibly been formed and extend fall to the Ichimoku cloud top (now at 1.2035), break there would bring test of the lower Kumo (now at 1.1995), however, only below 1.1957 support would confirm correction from 1.1876 is over and bring resumption of downtrend next week.
So in a nutshell, the outlook for EURO/USD will be still bearish next week, , the currency pair may have mild reversal up to the next resistace level 1.2216 before resuming its downward trend,,, breaking below1.1957 will expose next low toward 1.1860(recent low)
So SELL ON RECOVERY ( Near 1.2200) is proposed for week ahead
Chart A
Chart B
Chart C
Chart D
HAPPY TRADING
Wednesday, June 9, 2010
OUTLOOK on the EURO/USD , will reversal continue toward the 1.2130 (The currency pair historical midpoint) ??
After Careful review on the Wed session for EURO/USD, we observed that the mild reversal did hit the Daily upper trend line(1.2060), then it lost its momentum and back to 1.1956, and continuing its side-- way movements thereafter.
For equities, the Dow Jones Industrial Average temporarily climbed above the psychologically important 10,000 level before retracing its gains and ending the session in the red. And, despite the remarkable performance for the active NYMEX oil futures contract, it would nonetheless hovering in the region of $74.00
FROM THE ABOVE,, we are reminded that volatility is still exceptionally high; yet, the dominant bear trend is still firmly rooted. It just so happens that we are going through a period of congestion whereby the market is more responsive to fits of optimistic news.My opinion is that the Most liquid currency pair,EURO/USD is still in the Bearish Trend, and I will look for Many Opportunities to SELL ON RECOVERY.
The first chart below showed the momentous breaking of the intraday uptrend line, then reversed its course toward back to 1.1956.
The second chart shows that there is a upside Ich cloud capped at 1.2060, and it is recommended that you wait for its RECOVERY near 1.2060-1.2100, then SELL the pair accordingly...
I have an interesting report entitled" Preparing for the breakup of Euro Union"
Please go to my below link:--
http://docs.google.com/fileview?id=0B74IMi--bRpKMzRlYmY2OTgtMDFiMi00NTJmLTk5YTAtNzky
NWJlZjRkNGNk&hl=en
Happy Trading
For equities, the Dow Jones Industrial Average temporarily climbed above the psychologically important 10,000 level before retracing its gains and ending the session in the red. And, despite the remarkable performance for the active NYMEX oil futures contract, it would nonetheless hovering in the region of $74.00
FROM THE ABOVE,, we are reminded that volatility is still exceptionally high; yet, the dominant bear trend is still firmly rooted. It just so happens that we are going through a period of congestion whereby the market is more responsive to fits of optimistic news.My opinion is that the Most liquid currency pair,EURO/USD is still in the Bearish Trend, and I will look for Many Opportunities to SELL ON RECOVERY.
The first chart below showed the momentous breaking of the intraday uptrend line, then reversed its course toward back to 1.1956.
The second chart shows that there is a upside Ich cloud capped at 1.2060, and it is recommended that you wait for its RECOVERY near 1.2060-1.2100, then SELL the pair accordingly...
I have an interesting report entitled" Preparing for the breakup of Euro Union"
Please go to my below link:--
http://docs.google.com/fileview?id=0B74IMi--bRpKMzRlYmY2OTgtMDFiMi00NTJmLTk5YTAtNzky
NWJlZjRkNGNk&hl=en
Happy Trading
BP-- A POTENTIAL GEM to be picked ?? It falls to its 14 years LOW at $ 29.20 ??
BP, in the midst of further Lawsuits and new Penalties treats from US regulators, Plunged to its 14 year low at $29.20 in NYSE on Wed Close.
One will wonder whether BP will be bankrupt soon or the next Take-Over Target . Grave Concern over its future resulted in its Heavy SELL DOWN by Investors.
Here’s an interesting excerpt from Motley:-
HAPPY TRADING
One will wonder whether BP will be bankrupt soon or the next Take-Over Target . Grave Concern over its future resulted in its Heavy SELL DOWN by Investors.
Here’s an interesting excerpt from Motley:-
In a nutshell, the author reasons that BP’s recent stock price hit (down 50 percent) as well as its massive 9 percent dividend (on a trailing basis) justifies the risk. He then goes on to say that BP is in a reasonably good cash position to cover claims and to borrow if necessary.Estimates on how much the spill will cost vary greatly, ranging from lowball numbers in the $3 billion range all the way up to $25 billion or even $30 billion. When considering these hefty tabs, though, investors need to remember that BP has only a 65% interest in the oil field, with Anadarko Petroleum (APC) and Mitsui owning the rest. Driller Transocean (RIG), services provider Halliburton (HAL), and blowout-preventer manufacturer Cameron International (CAM) may also end up on the hook for part of the costs.
Thousands of Britons are invested in the British oil giant through pension funds -- analysts estimate that about 1 pound in every 7 pounds paid in dividends to British pension funds comes from BP.
Investors are eager for the crisis to be resolved. BP is a major player on the FTSE 100, London's main stock index, meaning that blows to its share price have significant effects on portfolios designed to track the index's performance, such as certain pension funds and insurance policies. The National Association of Pension Funds estimates that BP shares represent 1.5 percent of the total assets of pension funds in the United Kingdom.
So BP can also be classified as a Too Big Company To Fail Category in UK
Having said that,, BP fundamentals is still Rock Solid , and the only uncertainty lies in its incoming Lawsuits and penalties imposed by US authourity. Some details on WED trading is listed below:below :--
BP p.l.c. Common Stock
(NYSE: BP)
After Hours: 29.45
0.25 (0.86%) 7:59PM EDT
Last Trade: | 29.20 |
Trade Time: | 4:00PM EDT |
Change: | |
Prev Close: | 34.68 |
Open: | 33.96 |
Bid: | 29.44 x 100 |
Ask: | 29.45 x 2400 |
1y Target Est: | 51.76 |
Day's Range: | 29.00 - 34.45 |
52wk Range: | 29.00 - 62.38 |
Volume: | 240,808,467 |
Avg Vol (3m): | 29,050,500 |
Market Cap: | 91.42B |
P/E (ttm): | 4.59 |
EPS (ttm): | 6.36 |
Div & Yield: | 3.36 (9.00%) |
To get back to the main point, BP share price has plunged from its high $62.50(April, 2010) to $29.20 on 09 June 2010 Closing (NYSE), added with the proposed 9% dividend payout,, I would suggest to BUY and accumulate this stock gradually as the DOWNWARD momentum with high volume may drift down the stock price lower. Technicals indicate severe Oversold and may persist in the Bearish zone for some time.
Do Buy CALL Options TO PROTECT ITS Downward RISK when BUYING BP stocks
The price chart for BP is as below:-
HAPPY TRADING
Tuesday, June 8, 2010
HOW TO TRADE as a DAY TRADER in a RANGE-BOUND KL BURSA EXCHANGE ??
Some one ask me how to trade in a close Range-Bound Market such as KL BURSA Stock Exchange ?
My view on the KLCI is NEUTRAL, moving in a tight range between 1240-1300 for the next 6-12 months...
So you may lock up your CAPITALs subsequently. if you start to buy and invest FOR SHORT/MID TERMS.
BUT there is still a way to trade in the side-ways range bound KL markets.The proposal is to convert yourself to DAY-TRADER.
YOU MAY FIRST REFER TO MY LINKS BELOW:-
Warning: YOU CANNOT SELL "SHORTS" ANY STOCK IN THE KL Bursa exchange ...
REQUIREMENTs:
1) Do some studies/homework on the targeted stocks you intend to day-trade
2) Use all the available Indicator Tools/ Spot Trading info..etc. to assist you to identify volatile stocks with positive momentum /with substantial volume and liquidity on the slightly BULLISH DAY...
3) Select a good Broker/security company which can Offer attractive / Low Commission rate
4) You can initially start with RM 5000, and up... ,,depending on the stock price and its buying volume..
5) Close ALL your Positions in the Same days if possible...
6) Go for a holiday if it is a BEARISH day.....
7) Avoid "Rubbish " Stocks ---such as KENMARK, TALAM,.TRANMIL MMM,GPERAK, OILCORP . LCL, .... .....And many more....................
6) Go for a holiday if it is a BEARISH day.....
7) Avoid "Rubbish " Stocks ---such as KENMARK, TALAM,.TRANMIL MMM,GPERAK, OILCORP . LCL, .... .....And many more....................
I would like to stress that DAY Trading IS NOT SIMPLE, It carries the same amount of RISK as your normal way of trading the Stocks. But equipping /Arming yourself with more knowledge/ info /data IN REAL on-line ENVIRONMENT, YOU CAN CUT DOWN YOUR RISK SUBSTANTIALLY....
Always Try to start IT in SMALL and affordable Risk BEFORE you do it in a BIG WAYS.......(Max.RISK of 5% of your capital always)
NEXT IN THE PIPE-LINE,,...... I WILL SEND A POST ENTITLED "How to trade Futures (FKLI, FTSE, DAX, CAC, S & P 500,, GOLD, CRUDE,,).....
HAPPY TRADING...
Let me Introduce you to the EXCITING World of OPTIONS $$ ?
What is OPTIONS ??
YOU MAY HAVE HEARD IT MANY TIMES, But do you know its HUGE POTENTIAL ?
BUYING CALL OPTIONS CAN BE USED TO PROTECT YOUR STOCKS DURING BULL RUN,,,
BUYING PUT OPTIONS TO MAXIMISE GAINS DURING BEAR RUNS......
SELL OPTIONS JUST LIKE SELLING INSURANCE(As Agent) IN YOUR DAILY TRADING.....
AND MANY MORE IMPOSSIBILITIES......................
All the above seems to be impossible and illogical !! BUT if you can master this ADDED / New trading opportunities, you may reach your targeted DREAMS much faster.....
Just go to my link below to learn the trade ...:-
http://docs.google.com/fileview?id=0B74IMi--bRpKNWNlZGMwZjctYjlkOS00YTQ5LTg2OTktOGE0OTk1ZjdjNzQ3&hl=en
HAPPY TRADING...
YOU MAY HAVE HEARD IT MANY TIMES, But do you know its HUGE POTENTIAL ?
BUYING CALL OPTIONS CAN BE USED TO PROTECT YOUR STOCKS DURING BULL RUN,,,
BUYING PUT OPTIONS TO MAXIMISE GAINS DURING BEAR RUNS......
SELL OPTIONS JUST LIKE SELLING INSURANCE(As Agent) IN YOUR DAILY TRADING.....
AND MANY MORE IMPOSSIBILITIES......................
All the above seems to be impossible and illogical !! BUT if you can master this ADDED / New trading opportunities, you may reach your targeted DREAMS much faster.....
Just go to my link below to learn the trade ...:-
http://docs.google.com/fileview?id=0B74IMi--bRpKNWNlZGMwZjctYjlkOS00YTQ5LTg2OTktOGE0OTk1ZjdjNzQ3&hl=en
HAPPY TRADING...
Technical Outlook on EURO/USD, --TRADE SET UP REVIEW
The side-ways range bound has been ongoing for the past 3 trading days, and you should note that the Ichimoku cloud is getting wider and thicker, signaling the limited upside potential being controlled at 1.2050(this is the 50% Fibo Retracement between 1.2216 and 1.18676)
The break below 1.1876 (the recent Low) should accelerate the downward momentum to 1.1800, then 1.1639(The New Low in 2005/2006) .
Only above 1.2100 will signal a possible mild REVERSAL (Above the Ichimoku Cloud),,
The short term/mid term Bearishness is still persist.
Propose to SELL EURO on Recovery Near 1.19800-1.2000
Protective STOP :60 PIPS
Target : 1.1880 (Just above the recent low)immediate,,, then the remaining half balance trades should target at 1.1750 next ........
The break below 1.1876 (the recent Low) should accelerate the downward momentum to 1.1800, then 1.1639(The New Low in 2005/2006) .
Only above 1.2100 will signal a possible mild REVERSAL (Above the Ichimoku Cloud),,
The short term/mid term Bearishness is still persist.
Propose to SELL EURO on Recovery Near 1.19800-1.2000
Protective STOP :60 PIPS
Target : 1.1880 (Just above the recent low)immediate,,, then the remaining half balance trades should target at 1.1750 next ........
A NEW TRADE SET UP FOR AUD/USD,, A potential WINDFALL
THIS NEW TRADE SET UP FOR AUD/USD IS AS FOLLOWS:-
SELL AT 0.8265---0.8260
PROTECTIVE STOPS 60PIPS (0.8325)
TARGET : OPEN or 0.8050
PROPOSED TIME : KL/ SINGAPORE :07:00 WED,, (GMT: 23:00,, US PACIFIC 16:00 Tuesday)
Note: Gold is declining towards the 1220 level !!
You should have an excellent trade !!
The major rise from 0.6007 a wave (B) and the wave C of this 3-legged (B) commenced from 0.6248 which ended at 0.9389 (with a failed wave 5). Therefore, major wave (C) decline has commenced from there and the A leg is unfolding which is sub-divided into an abc-x-abc with first set of abc ended at 0.8711, followed by x wave at 0.9078 and 2nd a leg has ended at 0.8066, followed by 2nd b leg at 0.8552 and 2nd c leg may extend to 0.8000 and 0.7930.
Happy trading
The major rise from 0.6007 a wave (B) and the wave C of this 3-legged (B) commenced from 0.6248 which ended at 0.9389 (with a failed wave 5). Therefore, major wave (C) decline has commenced from there and the A leg is unfolding which is sub-divided into an abc-x-abc with first set of abc ended at 0.8711, followed by x wave at 0.9078 and 2nd a leg has ended at 0.8066, followed by 2nd b leg at 0.8552 and 2nd c leg may extend to 0.8000 and 0.7930.
Happy trading
BJCORP- - A stock listed on Bursa KL Exchange --an OPPORTUNITY to Buy ??
Please go to my recent posting on BJCORP via the following link:-
http://millionaireclub88.blogspot.com/2010/05/pick-on-bjcorp-stock-listed-in-bursa-kl.html
Following the "NON APPROVAL" from three opposition-ruled States on the Football gaming activities, fueled with the statement from PM that the" Licensing / Approval " may be subjected to "REVIEW" yesterday,.. , So the Bjcorp stock IS NOW UNDER SEVERE SELLING pressure (traded at 1.36 today).
Who will know that this can be the BEST Opportunity to PRESS Down the Stock price ,???
Bearing in mind that 1.30 is the 200D SMA, BUT 1.20 is the Low on FEB 2009...
(Just for info, if the price of the stock can be up from 1.20(Expected low) to 1.90(Recent High)., then its market capitalization can be further increased by more than RM 500 millions !)
I would suggest to start accumulate this stock around 1.20
HAPPY TRADING
http://millionaireclub88.blogspot.com/2010/05/pick-on-bjcorp-stock-listed-in-bursa-kl.html
Following the "NON APPROVAL" from three opposition-ruled States on the Football gaming activities, fueled with the statement from PM that the" Licensing / Approval " may be subjected to "REVIEW" yesterday,.. , So the Bjcorp stock IS NOW UNDER SEVERE SELLING pressure (traded at 1.36 today).
Who will know that this can be the BEST Opportunity to PRESS Down the Stock price ,???
Bearing in mind that 1.30 is the 200D SMA, BUT 1.20 is the Low on FEB 2009...
(Just for info, if the price of the stock can be up from 1.20(Expected low) to 1.90(Recent High)., then its market capitalization can be further increased by more than RM 500 millions !)
I would suggest to start accumulate this stock around 1.20
HAPPY TRADING
Monday, June 7, 2010
Review on the STATUS of Trade set up : EURO/USD..EURO/JPY,, AUD/USD
1) EURO/USD
SELL STOP : 1.1940
PROTECTIVE STOP:1.2030
TARGET: 250 pips
Proposed Date for Trade set up: 05-Jun-2010 (Saturdaty)
STATUS: Still valid in Trade , Now traded at 1.1930
New Change: Target set to :200pips
Update now GMT 13:20,, US PACIFIC 06:20,, KL/ Singapore / HK 21:09 Tuesday
2) EURO/JPY
SELL STOP :109.00
PROTECTIVE STOP:150 pips
HAPPY TRADING
SELL STOP : 1.1940
PROTECTIVE STOP:1.2030
TARGET: 250 pips
Proposed Date for Trade set up: 05-Jun-2010 (Saturdaty)
STATUS: Still valid in Trade , Now traded at 1.1930
New Change: Target set to :200pips
Update now GMT 13:20,, US PACIFIC 06:20,, KL/ Singapore / HK 21:09 Tuesday
2) EURO/JPY
SELL STOP :109.00
PROTECTIVE STOP:150 pips
TARGET:300 pips
Proposed Date for Trade set up: 05-Jun-2010 (Saturdaty)
STATUS: Still valid in Trade Now traded at 109.40
New Change: Target no change
Update now GMT 13:20,, US PACIFIC 06:20,, KL/ Singapore / HK 21:09 Tuesday
3)AUD/USD
SELL STOP :0.8115
PROTECTIVE STOP:150 pips
TARGET:300 pips
Proposed Date for Trade set up: 05-Jun-2010 (Saturdaty)
STATUS: Still valid in Trade Now traded at 0.8150
New Change: Target set to :300pips
Update now GMT 13:20,, US PACIFIC 06:20,, KL/ Singapore / HK 21:09 Tuesday
GENERAL COMMENTS:
If you look at all the above 3 charts with their respective Trade set-up, then you may discover SOME of the pair that actually you can make 1-2 rounds of good profit takings with the same SET UP (The price action is actually bouncing within your st range !With the proposed Protective Stops level, and you have no STOP OUT !.)
YOU SEE, THE Protective Stop level/limit are set with their ATR(Average True Range), which is one of the useful indicators available.
Hope the above can be of some assistance for your Daily trading !! Of course you need more analysis tools such as fibo retracement rules, support levels, resistance, pivot levels,Stoch. RSI, ..........etc to enable you to have better set up trades.
Foot note:I have an interesting report entitled "Preparing for a breakup of the Euro Union" by an Economic Analyst for Sharing via the following link:-
http://docs.google.com/fileview?id=0B74IMi--bRpKMzRlYmY2OTgtMDFiMi00NTJmL
Tk5YTAtNzkyNWJlZjRkNGNk&hl=en
Update now GMT 13:20,, US PACIFIC 06:20,, KL/ Singapore / HK 21:09 Tuesday
GENERAL COMMENTS:
If you look at all the above 3 charts with their respective Trade set-up, then you may discover SOME of the pair that actually you can make 1-2 rounds of good profit takings with the same SET UP (The price action is actually bouncing within your st range !With the proposed Protective Stops level, and you have no STOP OUT !.)
YOU SEE, THE Protective Stop level/limit are set with their ATR(Average True Range), which is one of the useful indicators available.
Hope the above can be of some assistance for your Daily trading !! Of course you need more analysis tools such as fibo retracement rules, support levels, resistance, pivot levels,Stoch. RSI, ..........etc to enable you to have better set up trades.
Foot note:I have an interesting report entitled "Preparing for a breakup of the Euro Union" by an Economic Analyst for Sharing via the following link:-
http://docs.google.com/fileview?id=0B74IMi--bRpKMzRlYmY2OTgtMDFiMi00NTJmL
Tk5YTAtNzkyNWJlZjRkNGNk&hl=en
(do copy the entire above address without space in between into your Browser)
Latest Update:
You may Exit the Aud.USD now(GMT 16::00) , KL/SINGAPORE 12:00)TRADED at 0.8130, THere may be a major Reversal in the horizon, as the Gold Gold price is on the upsurge,,,,heading to 1275...
Latest Update:
You may Exit the Aud.USD now(GMT 16::00) , KL/SINGAPORE 12:00)TRADED at 0.8130, THere may be a major Reversal in the horizon, as the Gold Gold price is on the upsurge,,,,heading to 1275...
HAPPY TRADING
ECB may want the EURO/USD to be 1.1800-1.1900 TEMPORARILY ??Equity and Futures REVERSAL IMMINENT ??
Be cautious, there are right now enormous No. and Quantity of Euros BUYERS ready to stop the Slide of EURO in the BACKGROUND.(Can be viewed by limited fews only), GMT 09:20,, US PACIFIC 02:20,,
KL/ SINGAPORE /Beijing 17:20,,
We can't identify who they are , but your guess may not be too far out. Now the pair is traded at 1.1948.
EXIT YOUR TRADES IF THE REVERSAL HITS ABOVE 1.2000
It looks like THEY may want the Euro/Usd to be within the range 1.1800--1.1900 Temporarily, So that they can buy some precious time to find a FIRE FIGHTING solutions ?(For Short TERMS)?? But we really do not know exactly which level they may want to defend strongly against with....
If the EURO/USD is being pushed up near 1.2000 and stagnant/stablized.,,... WE traders IS switching to major Future indices for potential REVERSAL !! We are buying Long now FTSE,DAX,CAC,S & P 500,,.....SLOWLY..*(Now FTSE is -0.95%, DAX -0.89%,, CAC -1.2%, S & P 500 -0.55%)
I AM STILL VERY BEARISH on the Euro Zone, and I am still SHORTing on all the Euro Crosses. Just keep your eyes open wide, and I propose that you may tighten up the Protective Stop and reduce your trade sizes / AND your leverage accordingly from now on......
Latest Update:The Euro/Usd is still strongly supported at 1.1990..(GMT 11:08,, US Pacific 0409)
BUT OUR SWITCHING TO FUTURE INDICES ARE BEARING FRUITS HARDLY AN HOUR LATER .........
AND THE FTSE,, DAX,, CAC,,S & P 500, DJ ARE NOW ALL NEAR POSITIVE NOW.....
FINAL UPDATE: GMT 12:25 ,, US PACIFIC 05:25,, KL/ HK /Singapore 20:25: Euro/Usd traded at 1.1985(Firm and stable)
Now FTSE +0.12% ,CAC +0.05,, DAX +0.2%, ,S & P -0.1%,DJ near 0%, so most probably ALL the three indices in US will be positive in the opening session ahead..... And we will hold on for a little while to maximise our profits in Future Indices..............
End this Posting now GMT 12:25,, US PACIFIC 05:25,, KL/ SINGAPORE/ HK 20:25
Final Note: We have just covered all our Futures contract.(GMT:12:45,, US PACIFIC 05:45,,)with an average of 0.65% of Europe indices(FTSE/DAX/CAC), and 0.25% on S & P 500 and DJ 0.12%)
KL/ SINGAPORE /Beijing 17:20,,
We can't identify who they are , but your guess may not be too far out. Now the pair is traded at 1.1948.
EXIT YOUR TRADES IF THE REVERSAL HITS ABOVE 1.2000
It looks like THEY may want the Euro/Usd to be within the range 1.1800--1.1900 Temporarily, So that they can buy some precious time to find a FIRE FIGHTING solutions ?(For Short TERMS)?? But we really do not know exactly which level they may want to defend strongly against with....
If the EURO/USD is being pushed up near 1.2000 and stagnant/stablized.,,... WE traders IS switching to major Future indices for potential REVERSAL !! We are buying Long now FTSE,DAX,CAC,S & P 500,,.....SLOWLY..*(Now FTSE is -0.95%, DAX -0.89%,, CAC -1.2%, S & P 500 -0.55%)
I AM STILL VERY BEARISH on the Euro Zone, and I am still SHORTing on all the Euro Crosses. Just keep your eyes open wide, and I propose that you may tighten up the Protective Stop and reduce your trade sizes / AND your leverage accordingly from now on......
Latest Update:The Euro/Usd is still strongly supported at 1.1990..(GMT 11:08,, US Pacific 0409)
BUT OUR SWITCHING TO FUTURE INDICES ARE BEARING FRUITS HARDLY AN HOUR LATER .........
AND THE FTSE,, DAX,, CAC,,S & P 500, DJ ARE NOW ALL NEAR POSITIVE NOW.....
FINAL UPDATE: GMT 12:25 ,, US PACIFIC 05:25,, KL/ HK /Singapore 20:25: Euro/Usd traded at 1.1985(Firm and stable)
Now FTSE +0.12% ,CAC +0.05,, DAX +0.2%, ,S & P -0.1%,DJ near 0%, so most probably ALL the three indices in US will be positive in the opening session ahead..... And we will hold on for a little while to maximise our profits in Future Indices..............
End this Posting now GMT 12:25,, US PACIFIC 05:25,, KL/ SINGAPORE/ HK 20:25
Final Note: We have just covered all our Futures contract.(GMT:12:45,, US PACIFIC 05:45,,)with an average of 0.65% of Europe indices(FTSE/DAX/CAC), and 0.25% on S & P 500 and DJ 0.12%)
Sunday, June 6, 2010
Total collapse in the East on EURO, JPY ,AUD Crosses , Then West is opening soon...
All carry trades have halted and wiped out now.
As Expected, as per my Trade- Set up for both Euro/Usd and Euro/Jpy,........
There is a total collapse of EURO AND JPY Crosses in the East trading session!
Euro/Usd was traded lowest at 1.1880, and EURO/JPY at 108.15 by GMT 01:31,, US PACIFIC 18:31,,, KL/ SINGAPORE/ BEIJING 09:31.
In approx. .6 HRS from Now, A heavier Hammer shall be exercised ,,, sending the Euro and Jpy CROSSES to a far distant Southern Zone.
You may also look at the AUD Crosses as the Unwinding of Risk Aversion is in Progress..... The Target for Aud/ Usd is 0.78000, Now is traded at 0.8110
Foot note: On AUD/USD, if you refer to my earlier posting on this currency pair , then you will know why 0.7800 may be the next support if the level at 0.8150 is violated . I hereby attach the below chart for your reference:-
HAPPY TRADING .....
As Expected, as per my Trade- Set up for both Euro/Usd and Euro/Jpy,........
There is a total collapse of EURO AND JPY Crosses in the East trading session!
Euro/Usd was traded lowest at 1.1880, and EURO/JPY at 108.15 by GMT 01:31,, US PACIFIC 18:31,,, KL/ SINGAPORE/ BEIJING 09:31.
In approx. .6 HRS from Now, A heavier Hammer shall be exercised ,,, sending the Euro and Jpy CROSSES to a far distant Southern Zone.
You may also look at the AUD Crosses as the Unwinding of Risk Aversion is in Progress..... The Target for Aud/ Usd is 0.78000, Now is traded at 0.8110
Foot note: On AUD/USD, if you refer to my earlier posting on this currency pair , then you will know why 0.7800 may be the next support if the level at 0.8150 is violated . I hereby attach the below chart for your reference:-
HAPPY TRADING .....
Saturday, June 5, 2010
Trade Setups FOR EURO/USD and EURO/JPY for Coming Week AHEAD
We just have an exciting week of Trading, irrespective of whether you are in Forex or Futures/Stock , IF you follow the trends closely and timely, you should have a very profitable trading week INDEED !
I do not design my trading strategy basing solely on News, CNBC, Bloomberg,.... or a chunk of Fundamental datas released in the Open Source, Since correct data / info are only available to a handful of Bankers, Central Banks, Investment Banks, Fund Managers, and you and I are definitely not in this special Circle.
I would recommend traders to base on Chart and Price Action , and follow the trading development closely while the trading session is in progress,, especially during this period with high volatility and flooding of Market Rumors.
1.)) Set up for EURO/USD
If you look at the DJ (see Attached chart), S & P 500, FTSE(see attached), DAX , you may derive that further downward pressure on all the Indices may continue , AND it may be resulting in further strengthening of Both the USD and JPY as RISK aversion unfolds.
Euro traders have long awaited a concrete plan of action that solves lingering fiscal crises, but current deadlock suggests markets may have to wait yet longer.Financial markets want answers and resolution, and the lack of compromise(ECB/IMF/GERMANY/EURO UNION) could force further Euro losses through upcoming trade.
Then back to the below EURO/USD chart, you shall see that the 1.2343 (Nov,2008 low) is now an immediate Resistance , and 1.1639 is the next immediate support (OCT 2005 LOW), and 1.1420 is the following next support. The trading range next week may be between 1.2000 (Psychology level) and 1.1639.
I will execute as follows:
SELL STOP on next Market opening AFTER COMPLETION OF FIRST CANDLE IN M5 CHART ( AROUND 1.1930-1.1940)
Protective Stop : 1.2030 (approx. 100 pips)
Limit :OPEN or 250 pips
JPY shall move in tandem with the USD,, AS the political problems in Japan has almost settled with the new PM installation. Looking at the chart, it will be self explanatory, (Various Fibo Level, Retracement..) . THE Technicals signals the severe Downward Pressure on this currency pair and the possibility of -1000 pips cannot be ruled out !!
The proposed set up for EURO/JPY will be :
SELL STOP at next MARKET OPENING AFTER completion of the First candle in M5 chart,(109.00--108.90)
PROTECTIVE STOP : 150 PIPS
LIMIT : OPEN
HAPPY TRADING TO ALL......
Subscribe to:
Posts (Atom)