Welcome to my Trading Blog

Disclaimer: This is my personal Blog, reflecting my very own views on Forex , shares and commodity tradings. As such, all informations provided here are barely for information purposes only,. The author should not be held liable for any errors, incomplete information, delayed messages, or for any actions taken in reliance on information contained herein.This blog is new, being established on 06,May.2010. While I am executing trades, posting will be sent simultaneously. The date/Time indicated here is of US Pacific zone(++15 Hours for Singapore/KL/Beijing, Or ++7 hours GMT)

Sunday, August 8, 2010

USD/JPY-----to retest 82.50 near term ??

In view of the fact that global bond yields are near their 16 months lows, aggravated by the expected further Easing measures from FED, we envisage that continual strengthening of Yen cannot be avoided near terms.


Technical Analysis

H4 Usd/Jpy Chart


Weekly Usd/Jpy Chart


On H4, we observe that  86.27 is a critical resistance/support  (just above the 61.8 % Fibo Retr) . Please do note that the daily Tenkan-sen line supports is near 86.50 , and the Kijun Line is  near 87.00.This can also be the retracement  level before it continues its next downward journey. The recent low at 85.02 shall be retested soon . 

On the Weekly chart, the next immediate support (Support 2) is 84.40.  Breaking this level may expose  82.50,( which is the 1.6180 extension on the Fibo ).

You may also note that the near term Extreme bearish sentiments on H4, DAILY  and Weekly charts.


In short, USD/JPY should head further down  below  84.00 near term.

Wednesday, August 4, 2010

GBP/YEN-----the GEM of FX of the week ??

Basing on the same thoughts  and reasonings  on YEN  on the USD/YEN  from my last posting here, incorporating the imminent weakness on the GBP  from now onward,  , in tandem with  the next big movement on RISK AVERSION prior to the NFP release, ,  I am thus  concluding that this GBP/YEN will be the GEM for the next few days. (For SELLING DOWN)


H1 for GBP/YEN


H1 for GBP/YEN (Expanded View)


On H1 chart, GBP/YEN is now testing the 136.80, (50% Fibo Retr) , which is also near the top Ichimoku cloud Support. Breaking this support convincingly shall expose the 136.57 ,(61.8% Fibo Retr), which is also near the Ichimoku Cloud Bottom Resistance.. Further downward shall see next support at 135.84 (its recent Low), then 134.90 0n Daily chart( 61.8% Fibo Retr on Daily Chart)


All indicators are confirming the Bearish downtrend near term

AUD/YEN------ another profitable currency pair is in the making ??

In view of the  imminent weakening  trend  on Aud  from now (time for this posting), and the likely movement of Risk Aversion on Yen in the next few trading sessions ahead of  NFP release,, (Please  refer to my last  two postings  relating to YEN Crosses, U/J  and GBP/J), I  therefore  reckon that this AUD/YEN currency pair may yield many pips  near term.


HI  for AUD/YEN


Aud/ Jpy is testing the immediate support 78.48 ( 50% Fibo Retr) which is also near the top of the Ichimoku Cloud.  Breaking this level may send it to the next support at 78.04(23.6% Fibo Retr), follows by recent Lows at 77.68, and  77.34 respectively


All indicators are confirming the bearish extreme for this currency pair.

USD/YEN -- the next STAR of FX of the week??

USD/JPY


In view of the poor forecast/expected  US  NFP release on this upcoming Friday, the gradual flow of Dollars into Yen may be accelerated in the next two days due to risk aversion., resulting in the bearish USD/JPY  pair.

FALLING BOND YIELDS are also helping to boost the yen as the US 2-year yield hit a new low of 0.526% and 10-year drops below 2.90%. 


H1 USD/JPY


H1 USD/JPY(reduced view)


Looking  at the  H1,  The PA is in the process of breaking down the Ichimoku cloud top and Tenkan -Sen  line near 86.25, ( also close to the 23.6% Fibo Retr), Below this support (86.25) shall expose 85.92( 50% Fibo Retr)  , follows by 85.80 ( 61.8% Fibo Retr, also near the Ichimoku Cloud Bottom ). At present, all indicators are pointing towards extreme bearishness.The downward momentum is very strong near term.


On the Weekly chart, the immediate support at 84.78 looks vulnerable, breaking this importance support level may expose 83.00 which is the psychological support level , bearing in mind that the 1994 low was registered  at  78.46.

Monday, August 2, 2010

USD/CAD----- next target on Parity ??


The crude oil which is hovering above  80.00 should strengthen Cad further with her expected lower unemployment  numbers and Better GDP / CPI /PMI  which are  all  to be released this week.

Cad is always a safe heaven target in view of her persistent currency strength.  It is not surprised to see u/cad to go below  1.0000   near term.

On daily chart , breaking the vulnerable support 1.0148( near 100 % Fibo Retr) ,,  should expose 0.9930. on weekly chart


Both daily and weekly charts indicate negatively biased with high degree of Bearishness.


Daily Chart u/cad


Weekly chart u/cad


USD/CHF---Will it go below Parity near term??

Fundamentally, U/CHF  should have been at its parity days/weeks ago. This can also seen from Swiss Fiscal Balance and excellent Financial health. You may go to their Trades office, their Federal bureau of Information to get the updated data which i will not discuss them here.  In view of this imminent strength of swiss franc which has always been considered a safe heaven during market with confusing  upheavals and uncertainty.

Technically, on  H4,  Bearish divergence prevails . The support at  1.0346 (100% Fibo Retr) looks fragile.

The breaking on this level (1.0346) shall send this currency pair towards the 1.0269 ( R3 support on Weekly Chart.)., follows by 0.9910. on weekly chart.


H4 U/CHF


Weekly U/CHF


Saturday, July 31, 2010

EURO/USD--------Where will be its next move ??

EURO/USD closed at 1.3048 , with 1.3108 being the highest in the  week.

On both Weekly and Daily Chart, we do note that the bullish trend are still intact, meaning the uptrend shall continue in upcoming weeks.


Weekly EURO/USD Chart


Daily Chart EURO/USD


Dollars Index Daily Chart


On the weekly chart, the immediate resistance (R3) IS 1.3184, (Just Above the 61.8% Fibo Retr) , and on Daily Chart, its immediate Resistance(R2) is 1.3134., Breaking these two resistances on two time frames shall push up this currency pair towards 1.3660 , near 100 SMA on weekly chart,  


However, if you look carefully the Daily Chart, the MACD is showing Bearish Divergence while  the PA is still moving up, and the risk of breaking the RSI trend line(in Purple color) and the confirming bearish divergence on Slow Stochastic (9,3,3) MAY indicate Exhausting  up-trend near term. 
SO PLEASE KEEP A CLOSE WATCH ON BOTH --THE SLOW STOCHASTIC FOR BEARISH DIVERGENCE , AND A POSSIBLE BREAKDOWN ON THE RSI  DOWNWARD TREND LINE AS INDICATED.......FOR POSSIBLE MAJOR REVERSAL SIGNALS

On the Dollar index chart, you can note that it is heading south toward immediate support 81.07, below this level may expose 79.60, the current Dollar Index trend is very bearish. My forecast for the dollar index will be 78.00 near term if the present downward momentum persists.

So the uptrend may continue further up but watch out for Reversal near term in region 1.3500-1.3700.

Further Fundamental Analysis on Euros Strength

In the meantime, the PIIGS are hard at work cutting their deficits for the benefit of the bondholders. Spain, for instance, has cancelled all sorts of public projects, and now Greek and Italy are following suit.


Euro Data released two days ago showed no change in the rate of unemployment across the Eurozone, which stood at 10% during June. Data for consumer price inflation across the Eurozone for July showed a pick up in the rate by three-tenths to 1.7%.


Despite the marginal miss on US GDP, which came in at a slower 2.4% between April and June on an annualized seasonally adjusted basis, the dollar is holding up relatively well. BUT  there is a critical effect on weakening Dollars with Bernanke recent statements.::-


Bernanke acknowledged FEW days ago that the US-economy faces an “unusually uncertain time,” but if necessary, he hinted the central bank would resort to “Quantitative Easing,” (QE), or printing vast quantities of US-dollars, in order to prevent a deflationary spiral. With the US federal funds rate pegged near zero-percent, Bernanke was asked by Senator Jim Bunning if the Fed is “out of bullets,” Bernanke responded, “I don’t think so. We are prepared to take further policy actions as needed to foster a return to full utilization of our nation’s productive potential and price stability.”, MEANING  keep printing Dollars at maximum capacity...


However, A so-called EURO bank stress tests,,  ,(84/91 passed)which ( propaganda tool ) helped to trigger a 100-bps slide in credit default swaps on Greek bonds, to 825-bps this week, and down sharply from a record 1,320-bps.

With CDS rates on Greece’s debt receding, the demand for the deficit ridden US-dollar has also waned. In addition to the Euro, the biggest winners in the anti US-dollar sweepstakes were the Australian dollar, Swiss franc, and the British pound. China took advantage of the US-dollar’s rally in May, by dumping $32.5-billion of its holdings of US Treasury notes to US$867.7-billion.


The yield spread between the US Treasury’s 10-year note, and the German Bund, tumbled by 60-basis points (bps) over the past seven weeks, eroding the value of the US-dollar index by eight-percent. German bund yields bounced slightly above their record lows of 2.50%, after it became increasingly apparent that the ECB is not inclined to cut its 1% repo rate anytime soon. The ECB engineered a recovery of the Euro, from a four-year low of $1.1850, to as high as $1.3045, while traders detected the central bank was phasing out its purchases of Greek and other sovereign debt, at a much earlier than expected date.


FROM THE ABOVE two charts, , you can see that Euros proves to be more responsive to rising bund yield than USDX (dollar index) is  to  US  BOND YIELD.
EURO/USD  correlation with German 10- year yield is around 0.900,, vs the -0.60 for the correlation between the USDX and US 10-year yield.


That means Euros/Usd  will rise further up in view of the rising German 10-year yield near term.


GBP/AUD ----- A golden currency pair to bet ??

In view of the lower than expected inflation rate, RBA (Australia) is again  expected to keep Rate unchanged. However, we have a Hawkish BOE ( UK) statement  on the higher prospect of increasing her Rate near term.

The above contradicting  scenario will result in an interesting trade on GBP/AUD., and as usual , AUD is always a target on Risk Aversion.

H4 Chart GBP/USD


On  H4, we note that if the PA (Price Action) can break the Ichimoku cloud top resistance near 1.7376, then the next target 1.7543, being its next resistance shall be exposed., follows by higher next target at 1.7815(61.80 %   Fibo Ext).

There may be another bad news for AUD,:- Market rumor says the China PMI data might have fallen sharply when August data is released with some predicting a dip for manufacturing beneath the 50-line meaning contraction for the first time in 18 months.

This is a very interesting and rewarding trade, with possibility of over 200 pips gain. You may wait for pull back on upcoming Monday , and looking for the best opportunity to BUY UP.

Wednesday, July 28, 2010

EURO/USD---Is Euro recent strengthening and its Bullishness Sustainable ??

FUNDAMENTAL ANALYSIS ON EUROS


The growing confidence and excessive evidence of  slowing down US economy is driving the Euros now.


Every one  got a bit too excited about the idea the euro-area was going to break up and forgot that the US has a whole load of problems of its own,”

Germany leads the way by enforcing Fiscal Balance and tightening spending in the euro,  after the EU countries in the region announced budget cuts and the European Union crafted a E750-billion ($970 billion) financial backstop in May to forestall defaults. Spain, Portugal, Ireland and Greece successfully auctioned more than E17 billion of bonds and bills since July 13.
 
Speculation the recovery would accelerate increased when Germany’s Ifo institute said July 23 that its business climate index unexpectedly jumped to the highest level since July 2007. A composite index of European services and manufacturing industries climbed to 56.7 in July from 56 the month before, London-based Markit Economics said a day earlier. 
Even though highly suspicious on the release of the recent STRESS TEST Report,  Investors showed little surprise on July 23, when the ECB Officials  said seven of 91 EU banks subject to stress tests failed with a combined capital shortfall of  only E3.5 billion. The euro rose 0.2% to $1.2933 as of 8:48 am in London, after appreciating in three of th only e past four weeks. The 16-nation currency appreciated 8.9% since June 7, when it slid to $1.1877, the weakest level since March 2006. It also advanced 2.5% since falling to a more than seven-year low on June 29, according to Bloomberg Correlation-Weighted Currency Indexes. 


We have now a reversed Outlook on EURO/USD

Citigroup’s euro, region economic surprise index reached a three-year high of 131 on May 27. The equivalent US gauge fell to a 16-month low of minus 43.6 on July 1. The measures examine historical standard deviations of data surprises by comparing releases with Bloomberg median estimates
Goldman Sachs analysts reversed their outlook for the euro twice in two months, and said in the most recent forecast that the dollar will weaken against the euro by January as US growth slows. The New York-based bank says the shared currency will reach $1.22 in three months, $1.35 in six months and $1.38 in a year. 

The main positives for the euro have been stronger-than-expected euro economic numbers and a recovery in risk appetite.However, we still insist that w
hile US growth has slowed more than forecast, the economy will still outpace Europe over the coming year as budget cuts start to brake the recovery

The US economy will expand 3.1% this year, according to the median of 55 analyst forecasts compiled by Bloomberg. The euro-region will grow 1.1%, a separate median estimate shows.
 

German Chancellor Angela Merkel’s Cabinet approved four years of budget reductions and revenue programmes worth E81.6 billion on July 7. Greece aims to cut its budget deficit to 8.1% of gross domestic product this year, from 13.6% in 2009, and meet the EU’s 3% limit by 2014. Portugal plans to reach the EU target by 2012, reducing it from 9.4% last year.
 

The euro-region deficit will narrow to 6.1% of the GDP in 2011 from 6.6% this year, according to European Commission forecasts on May 5. The US gap will hit 10% in 2010 and 9.9% next year, the figures show. While European governments are pruning, US President Barack Obama signed into law a $34 billion extension of unemployment benefits on July 22.
 

As I am a strong advocate for Fiscal Balance, Any country which can EARN more than her Spending, then her respective currency strength will be awarded by All  investors. AND unfortunately, US is out of this category.  The FED is now  printing the Dollars  25 Hours /Day.

For Europe, it may be painful in the short-term, but they are dealing with it. The US, which has a much bigger problem, isn’t even beginning to deal with it.


Summary:

NEAR TERM, EURO/USD Shall Hover near 1.3500, and by end of this year 2010 to reach 1.4000.


Monday, July 26, 2010

EURO/USD---1.3700 or below 1.2300 ?

Euro/Usd  continues to be an interesting currency pair to be closely watched.

After the highly suspected European Bank Stress Test release follows by the surprised US encouraging new home sales data , so what will be in store next to result in its next Big Move ??

Basing on Technicals, looking at Both the H4 /Daily charts with Trend line(drawn in Purple color), we can spot that breaking the Resistance 1.3085 may expose the next 1.3741(1.618 Fibo Ext. on Daily Chart.) , and  do note that the presence of various Bullish Engulfing candles are telling  the stories better than words on recent movements.,  The present bullish bias may persist for longer periods.

However, on the Downside, on Daily chart, breaking below the Ichimoku Cloud top near 1.2770 ,may send this currency pair towards the next possible support near 1.2300, the 38.2% Fibo Retr level and also the same location for the Ichimoku Cloud Bottom resistance line.

H4 E/U with Trendline 

Daily E/U with trend line


Daily E/U with Ichimoku


H4  E/U with analysis on Prices/ Range  movement


I would like to quote the followings from JIM O'Neill  from Goldman Sachs:--


“Foreign exchange is the world’s biggest fruit and vegetable store, with millions of people playing it 24 hours a day,” Goldman Sachs Chief Global Economist Jim O’Neill said on July 21 in a radio interview with Tom Keene on Bloomberg Surveillance. “Anybody who thinks they can get foreign exchange right all the time should be in a lunatic asylum.”


""Unquote, 


HAPPY TRADING...

Sunday, July 25, 2010

GBP/JPY ---a next Super Star of FX ?

The imminent rising strength on British pound  and the "Apparent Weakness" of the Yen shall yield maximum pips for FX  Traders.  All Technicals are pointing Bullishness near term.

On Daily Chart, breaking the Ichimoku Cloud Top resistance near 136.33 shall send this currency pair going beyond 141.67  (50 % Fibo Retr, from 126.67 low to 156.76 high, on WEEKLY  Chart)


Daily Chart GBP/JPY


H4 GBP/JPY

STRATEGY

BUY near 135 (near its  first resistance on H4 )

Target: ; First Target: 136.30, follows  by 141.67 next

EURO/JPY--- Bullish near terms ?

Technically, EURO/JPY should head for further North near term. 

On H4, 113.37 ( the recent high) should be tested shortly,

On Daily Chart, 114.38 ( 100% Fibo Ext) is its next resistance., follows by 117.90 being the Ichimoku Cloud Top Resistance.


H4 Euro/ Jpy Chart


Daily Euro/Jpy Chart


STRATEGY

BUY near 112.50 (the Pivot level on Daily Chart)

Target:  113.35, follows by  114.35, then 117.90

USD/JPY----- Is it ready to go North ??

Technically, Usd/Jpy has shown its Bottom Formation last week, and is ready for an upward Journey now.  I would not  speculate on the Currency Intervention by BOJ, but my opinion should base on Technicals Strictly.

If the present upward lift can clear the Ichimoku Cloud Top near 87.70 on H4 Chart, which is also the 50% Fibo Ext. Level, ,,then next resistance at 88.00(38.2% Fibo Ext. LEVEL) may be exposed,,, follows by  88.45 (23.8% Fibo Ext) next., then 89.10 (0.00 % Fibo Ext ) on H4 chart.


H4 USD/JPY

STRATEGY

BUY USD/JPY  near 87.35-87.40 (its 61.80% Fibo Ext) on H4 Chart

TARGET: First Target: 88.00, follows by 88.40, then 89.10  next ( 0.00% Fibo Ext) on H4

NZD/USD-----When will its upward momentum be halted ??

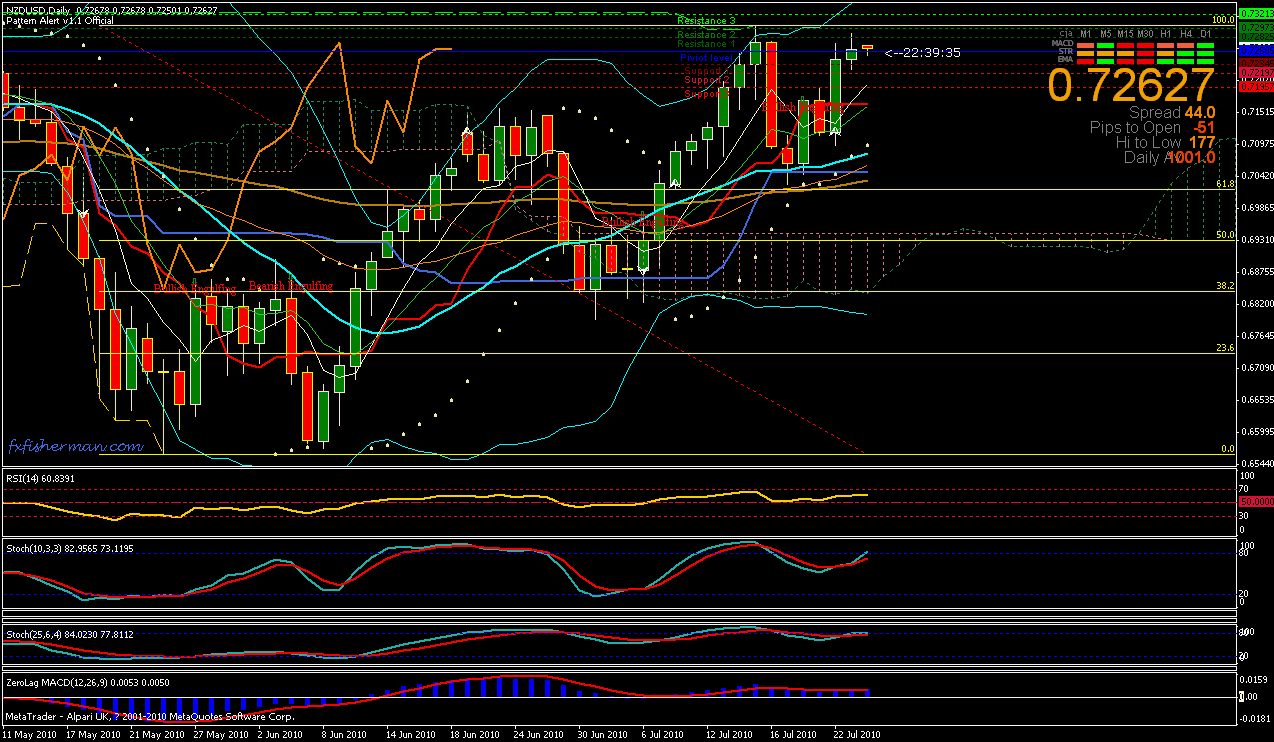
Nzd/Usd touched 0.7300 last week.

On Daily Chart, the Bullish Divergence may indicate the possibility of further upward momentum near the next resistance 0.7321 which may be the upper limit near term on Daily Chart.

On Both H4 and Daily Chart, You may spot the Double Tops Formation is in the Making, whereby the 0.7300 may be the limiting level.


Daily Chart


H4 NZD/USD


STRATEGY

SELL Down near 0.7300-0.7320

Target: First Target: 0.7165 (Tenkan-Sen line on Daily Chart)
            Second Target: 0.7020 (61.8% Fibo Retr on Daily Chart)

AUD/USD----A journey to the South to begin soon ??

Aud /Usd  reached 0.8969 highest Last week. The Bullish divergence on both H4 and Daily Chart  may indicate the possibility of further upward movement till the next resistance at 0.9011 on Daily Chart .

Basing on Elliot Wave analysis, not shown, the next residual wave may end at near 0.90500 , which is also the Fibo projection of 1.2700 being 0.9025  ( From recent low 0.8083 to recent high 0.8850)


Daily Chart AUD/USD


H4  AUD/USD

Strategy

SELL DOWN on further Lifting movement  near 0.9025-0.9050

Target : First Target is 0.8720 (Ichimoku Cloud Top Support on Daily Chart)

Thursday, July 22, 2010

Updated views on EUROS, YEN, POUNDS and AUD

Intra-day Views on the above four  currencies  are listed below:-

1.0) Euros


The Euro/Usd was capped at 1.3000  and is awaiting to retrace down to the possible 1.2500 support level shortly.    However,  the immediate resistance at 1.3000  has not been breached convincingly . A  breaking  of the level near 1.3000-1.3050  may result in reaching  1.3250 which may be the last residual waves limit..  A bearish downturn can only be confirmed once the LOWER  trend line is being convincingly broken  into as indicated in the above chart.


2) YEN

85.00 is the important psychological support for USD/JPY. Failure to stop the slide may send the currency pair towards the 80.00 level which is the 1995 Low. It is not likely that the upper trend line can be breached near term. The downward momentum is very strong basing on the current trend.


3) UK Pound


The  Gbp/ Usd  is now sitting on the lower trend line, with bearish divergence on both RSI/STOCH/MACD , we may expect GBP/USD to test for retracement near 1.4800 soon.   Breaking this support may expose 1.4200 as indicated from the above chart.


4) AUD

AUD/USD  has breached the upper trend line  0.8850 yesterday, registering a high of 0.8950, and next target at 0.9400 is possible near term , as Bullish divergence are confirming  its uptrend.. Any reversal below the rising trend line will signal bearishness.

Wednesday, July 21, 2010

USD/JPY----It goes Down and Down, will it stop below 85 only BOJ knows..

USD/ JPY is a very interesting and rewarding  FX pair to be traded.

Please see the below charts and the following comments:


H4 Chart USD/JPY  , showing its narrowing trading range


Daily Chart, showing the longer term Movement


Please refer to my recent postings on the YEN , its strengthening background due to risk aversion, as more Dollars and Euros are being dumped into YEN for safe heaven purpose.


In view of the fact that Mr. Kan's Seat is still shaky( Japanese PM ) , he may not have time to think over the Intervention process for BOJ.  as such , the probability  of  BOJ  forcing down Yen  strength is rather slim near term.


Traders are now very worried over the imminent BOJ move, as can be seen from the above H4 chart, the  trading range has been narrowing over the past two weeks.


Looking at the Daily chart above, indicators are confirming near term bearishness. The plunge below the psychological level 85.00 will be sooner than expected. As there is no more meaningful  support  between the present level and 85.00.


Trading Strategy


SELL down USD/JPY is to be continued


PUT on Trailing Stops (Critical) (In case of Intervention by BOJ)


SL===70 PIPS (Average Range)


Target: Just above 85.00


NOTE: You may use the same principles to trade Euro/jpy, GBP/jpy, but study the YEN  strength with respective to the strength of GBP and Euros.


Further Note: euro/j, gbp/j , usd/j are ALL VERY PROFITABLE PAIRS TO BE TRADED RIGHT NOW


HAPPY  TRADING


Tuesday, July 20, 2010

USD/CAD ---- Another profitable trade on the eve of Canada's Rate revision ??

In view of the persistent weakness of Dollars recently, the upcoming rate revision from BOC ( Today 09:00 EST ) which may  present  to all  forex  Traders with another golden opportunity on USD/CAD .

We do note that USD/CAD has moved up over 300 pips over the last three trading days, that is rather abnormal without much convincing technical /Fundamental supports.

On H4, breaking below 1.0475, being the Ichimoku Cloud Top would signal its rapid plunging towards 1.0391 (its 38.2% Fibo Retr,), follows by 1.0274 (its recent low)

Strategy 

SELL Down near 1.0530 ( near its pivot,, on slight recovery)

SL==60 PIPS

Target: 1.0390, follows by 1.0270


H4 Chart of usd/cad


Monday, July 19, 2010

GBP/CAD---An Interesting Star-Trade of the Day ??

In view of the imminent weakness of British Pounds and the upcoming rate revision from BOC , coupled with the recent rise of the pair, we reckon that it  may be the star of trading for today.

Please note that  BOC is expected to increase her interest rate from 0.50  to  0.75 today (09:00 EST)


H1 Chart for GBP/CAD


H4 Chart for GBP/CAD


From the H4 chart, a perfect Double top FORMATION  is being finalized.. A rise of almost 750 pips over the last few days can be noted too on H4.

From the H1 chart, a break below 1.5950, ( near both the 100 SMA and Ichimoku Cloud bottom )shall see this pair  charging towards 1.5415 (its recent low) and beyond.(see also H4 Chart)

Strategy

SELL DOWN GBP/USD near 1.6040 (slight recovery)

SL===60 PIPS

Target: 1.5950(H1, 100 SMA), follows by 1.5813 (H4, Ichimoku Top), and 1.5418 (H4, Recent Low)

Please note that  you  may have the potential to gain over 600 pips