Welcome to my Trading Blog

Disclaimer: This is my personal Blog, reflecting my very own views on Forex , shares and commodity tradings. As such, all informations provided here are barely for information purposes only,. The author should not be held liable for any errors, incomplete information, delayed messages, or for any actions taken in reliance on information contained herein.This blog is new, being established on 06,May.2010. While I am executing trades, posting will be sent simultaneously. The date/Time indicated here is of US Pacific zone(++15 Hours for Singapore/KL/Beijing, Or ++7 hours GMT)

Sunday, September 12, 2010

EURO/USD ---TO retest 1.2200 soon ??

FUNDAMENTALS on Euros and Dollars
The Euro is mostly higher as fears are subsiding about a return of the debt crisis that plagued the common currency only months earlier. Industrial production figures were mixed, as France increased but Italy declined.
The euro is now struggling with the $1.2700 watershed.


the euro recovered with the help of scatter talk of official or quasi-official interest. Euro demand on the crosses, especially the yen and Swiss franc was also reported.

After a summer respite from concerns about the solvency of European banks, several countries are once again rattling markets and the euro currency. Most recently news that Ireland  may appear to be insolvent  has taken center stage. But not to be forgotten is Greece, the epicenter of the financial earthquake which rocked Europe this spring.

Euro buying against sterling and a healthy reception to the Irish bill auction helped the euro recover from the test near $1.2660. Euro needs to surmount formidable resistance in the GBP0.8280-GBP0.8300 band to boost the near-term outlook. Strong Australian jobs data helped drive the Australian dollar to new highs since 5-month

Following last week’s show of health in the shape of reasonable U.S. job creation, investors find themselves at the start of the same cycle witnessed back in the second quarter. Growth around the world appeared to be picking up at the time, while the punishment ailing the euro began to run out of steam. The risk-on rally reflected the disappearance of clouds on the horizon. As we fast forward to today, a similar picture is emerging. The pressure is once again off the U.S. economy as the modest pace of improvement continues. Decoupling is once again emerging as a theme now that a Chinese slowdown has passed the turning point. Once again the emergence of clouds across Europe surrounding a worrisome sovereign debt crisis is detracting from overall risk appetite as the euro and British pound stand out as heavyweights again today.
The tailwinds of the sovereign debt crisis that sank the euro earlier in the year continue to gently whistle across the region. Earlier in the week the Association of German Banks estimated that its top 10 bankers would need to raise €105 billion in fresh capital. Today ECB member Juergen Stark addressing German lawmakers repeated that warnings and noted that state-owned Landesbanks and German savings banks were the greatest threat to sovereign risks. The FT Deutschland newspaper notes that the latter were not subject to the rigors of the recent European bank stress tests. 

The Fed’s Beige Book yesterday reported ongoing recovery although at a decelerating pace between mid-July and the end of August. While the risk rally for commodity dollars has seen the dollar lose ground


In short, Both Dollars and Euros are having their very own  problems, and the movement of EURO/USD is really depending on the Risk appetite and the general sentiments in upcoming weeks.


TECHNICAL  ANALYSIS


Daily Chart with trend line and EW 


Daily Chart with Ichimoku


On the Daily chart with Trendline and EW,   if we consider that the recent high at 1.3324 being marked as A  , its fall on the anticipated Three waves a,b, c, marked in brown lines may be adhered to near term. 1.2916 (50% Fibo) and 1.2478 (0.00 % Fibo ) and 1.2140 as possible next targets. A  goes down down to B , whereby B is also considered near c which is the third waves (a,b, c), in the region 1.2140-1.2200
On the Upside, a breach of the upper trendline near 1.2916 shall send this pair retesting the  1.3000 (61.8% Fibo) , follows by 1.3324


On the Daily Chart With Ichimoku , we note that the Ichimoku Cloud bottom support is near 1.2600, breaking this may expose 1.2480 (0.00 Fibo) , then 1.2140, its recent Low.
On the upside, breaching the 1.3020,Ichimoku Cloud Top resistance (it is also near its 61.8% Fibo Retr)shall expose this currency toward  1.3324 , being its recent High.

USD/CHF---WHEN WILL IT GOES TO PARITY ??

The strength of Swiss Franc persists due  to its excellent fundamentals and  continual maintaining its safe heaven currency status. 
The day for achieving parity for USD/CHF is unavoidable near term.


Daily Chart 


Weekly chart with triple Tops Formation 


Daily Chart with Ichimoku


Looking at the WEEKLY Chart, we may note the formation of Triple Tops, and the current extreme bearish sentiments shall send this pair toward the 0.9916 (its low on Nov, 2009).
The daily chart with trend line is enhancing the bearish trend even though the PA has breached the upper trend line temporarily.
AN INTERSTING POINT TO NOTE, The moment this currency pair touches its new low,that will be the excellent LONG trades opportunities never to be missed by all FX traders.


On the Daily Chart with Ichimoku, the same bearish sentiments are presented., and the testing for the recent low at 0.9916 cannot  be discarded.
However, on the upside, only breaching the Ichimoku cloud top resistance near 1.0520 (also near the 23.6% Fibo ) WILL THEN CONFIRM ITS BULLISH REVERSAL.

USD/CAD---- TO RETEST 1.0000 NEAR TERM ??

FUNDAMENTALS

The Loonie is mixed despite the better than expected employment report on last Friday in what is likely a case of profit-taking. Canada added 35.8K jobs vs. an expectation of 30K, though the unemployment rte ticked higher to 8.1% DUE TO PROFIT TAKING


The central bank’s increase in interest rates last week may well not be the last should such a trend continue. The dollar came off its peak to trade at 96.83 cents an hour after the release as dealers digested the report.

Last  weeks rate hike (3rd of the year) and the jump in the PMI, has extended USDCAD selloff from last weeks 1.0570s highs to 1.0280s. 1.0250/1.0100  seen as the next targets in focus.


TECHNICAL ANALYSIS


H4  chart with trendline and EW


Daily  Chart with Ichimoku


On the H4 Chart with Trend line and EW, We do note that it has completed its a,b,c wave descend from the high A near 1.0566. Now this currency pair is testing the support near 1.0286 (its recent low). The lower Trend line is near 1.0200. Successful breaking the lower trendline shall retest its parity near term.
On the upside, 1.0400 is the Resistance 2, near the upper trendline. Breaching both of them shall see this pair retesting 1.0480(50% Fibo) , and 1.0530(38.2% Fibo)


On the Daily Chart with Ichimoku, 1.0323 is the Ichimoku Cloud Bottom support, also near the 61.8% Fibo, and support 3 is near 1.0250. Breaching these levels shall send this currency pair toward Parity.
On the upside, successful breaking the Ichimoku Cloud top resistance near 1.0400 (also the 50% Fibo), and the 1.0542 (23.6% Fibo) will confirm  its Bullish reversal.

GPB/USD---IS IT READY TO GO BELOW 1.5000 ??

Fundamentals on GBP

The Pound is mixed last week as lower than expected PPI figures are likely to allow the BOE to maintain accommodative monetary policy going forward.

– Inflationary pressures cooled off in August according to a producer price report released earlier, but the boost to the pound has long since evaporated. The cost of goods leaving the factory gate rose by a smaller than expected 4.7% on the year ago, while the cost of raw material inputs reversed course as the pound gained ground during the month. The pound has now lower at $1.5395 having reached $1.5467 in response to the earlier data.


As expected the Bank of England made no changes to policy at Last Thursday’s MPC meeting . Inflationary pressures cooled off in August according to a producer price report released earlier, but the boost to the pound has long since evaporated. The cost of goods leaving the factory gate rose by a smaller than expected 4.7% on the year ago, while the cost of raw material inputs reversed course as the pound gained ground during the month. 


TECHNICAL ANALYSIS

Daily Chart with Trendline


Daily Chart with Ichimoku


On the Daily Chart with Trend line, we note that the lower horizontal trend line is near the 1.5340(38.2% Fibo), both the RSI  and MACD indicate Bearishness near term, Breaching this lower trendline will retest the 1.5200 (23.8% Fibo) , and  1.4940 next(0.00 Fibo)
On the upside, breaching the upper trendline and 1.5600 (61.8% Fibo) will confirm its short term Bullish Reversal toward 1.6000.


On the Daily Chart with Ichimoku, Breaching below 1.5180 being the Ichimoku Cloud bottom support (also the 23.6% Fibo) will expose  1.4950 (0.00 % Fibo)
On the Upside, breaking above 1.5620,being  the Ichimoku Cloud top resistance, (also the 61.8% Fibo) will retest 1.6000 (0.00% Fibo)

Monday, August 30, 2010

EURO/USD-------TO BE SETTLED NEAR 1.25000 NEAR TERM ??

EURO/USD H4 with Ichimoku Chart


Daily Chart


Trading Analysis


Fed  Bernankes speech highlighted 2 key points; purchases of long term assets are his favourite option for additional easing; and the central bank will not breach its commitment to price stability. The preference of additional asset purchases over communicating a longer period of exceptionally low rates and reducing interest rate on reserves allow for the possibility of renewed expansion of the Feds balance sheet. I therefore envisage that  there  was  NO REASON for USD to rise when Bernanke keeps the door open for QE(That means printing more Dollars via printing presses)


On H4, we observe that for the past 14 trading days, this currency pair moved within the range 1.2850-1.2600 for the past 12 Trading Days.


On the Downside, on H4 with Ichimoku chart , ITS IMMEDIATE SUPPORT IS SUPPORT 2, at  1.2675. Breaking this level may send this pair down to its next support near 1.2590, its recent low, follows by 1.2431.(61.8% Fibo)


On the upside, successful breaching the 1.2850 ,its 38.2% Fibo, also near the Ichimoku Cloud Top Resistance(on H4)., may resume its reversal toward the 1.3000 level. 


This currency pair now is negatively biased /with bearish sentiments.But upside should be limited by 1.3000 resistance and bring fall resumption. Below 1.2600 will target 61.8% retracement of 1.1875 to 1.3330 at 1.2431 next. 


Further down the road may send this pair to retest the 1.2000 level( 61.8% Fibo between 1.6040 to 0.8223, on a much longer prospectives) 

Sunday, August 29, 2010

AUD/USD----WHEN WILL IT BE GOING BELOW 85.00 ??

AUD/USD


H4 with Ichimoku Chart


H4 with ab-cd movements colored in Purple with potential Double Tops

Trading Analysis


On the H4 Chart with ab-cd movements completion drawn, you may note that there is a completion of Double Tops being capped at 0.9050  on the H4 chart. The PA is now ripe for rapid descent, coupling with bearish sentiments.


On the H4 with Ichimoku Chart,, 0.8940 is its next immediate support, being the Ichimoku Cloud Tops support, near the 38.2% Fibo, Breaking this support may expose its next support near 0.8875(61.8% Fibo) , and 0.8769 next, (being the recent low)

U/CAD-------WILL ITS NEXT TARGET BE 1.0000 ??

We observe the consolidation of U/CAD last week, and on  daily Chart, we can see the completion of ab-cd movements which are colored in Purple. If you observe the attached Daily Chart, you may spot the completion of Double/ Triple Tops,, resulting  the PA on its Bearish descent near term.
The recent recovery of Crude oil price may lift this currency pair much faster in its descent.


H4 with Ichimoku Chart


Daily Chart with ab-cd movements and Double/Triple Tops


Trading Analysis.


On H4 Chart with Ichimoku, Bearish Sentiments shall send this pair towards the 1.0400 (Support 3, or 38.2 Fibo% Fibo) , also near the Ichimoku Cloud Bottom support on H4.,. Below this important support shall expose 1.0345( 23.6% Fibo),follows by 1.0246 (Its recent low)

On Daily Chart, as ststed above, Both the completion of ab-cd movements and Double/Triple Tops shall further enhance its Bearish downward movement near term.. And the possibility of retesting its PARITY cannot be discarded.

YEN Crosses --what will be the Direction after rumors on Further Liquidity Easing Measures and Various BOJ Potential Actions?

Yen is still considered a Safe Heaven Currency irrespective whatever actions are to be taken by BOJ.
Last FRIDAY's YEN SELL-OFF was INITIALLY TRIGGERED by a Nikkei News report (early Saturday edition), stating the BoJ may move forward its September 6-7 meeting to next week. However, towards the London's Close, the weakening Dollars fueled the SELLING of Yen.


The early Monday  Asean trading session with  Bullish sentiments on Asian Equity has stamped the selling
 Pressure on the  Yen which shall now to be ON HIS USUAL Strengthening course 
. 
The Further confirmation on the Easing Measures to be implemented by BOJ shall further Lift the Yen due to Risk Aversion.


1) USD/JPY


H4 with Ichimoku Chart


H4 with ab-cd Chart


Trading Analysis.


On the H4 chart with ab-cd completion drawn in Purple color, we expect the down-trend shall continue near term.
The Bearish divergence with negative sentiments shall drive this currency Pair towards the 84.24 ( Support 2, near the 23.8%  Fibo Retr), , below this level may expose 83.60 (its recent Low)


On H4 with Ichimoku chart, 85.00 is the Tenkan-Sen support, Going Below this Point shall drive down rapidly its next support level  at  84.50.


On the Upside,  PA breaching the 87.00 (50% Fibo level) will confirm its Bullish Reversal.


2)  EURO/ JPY


H4 with Ichimoku Chart


Daily with ab-cd Chart


Trading Analysis


On the H4 with completion of ab-cd which are colored in purple,, we expect the PA shall now be going down after minor  PULL back last Friday.The sentiments are bearish/negative biased.. Next Support at 107.02 (just below  the 61.80%Fibo) shall be tested soon, breaking it may expose 105.40 next


On H4 Chart with Ichimoku, we do note that 107.50 is a strong Tikun-sen support (Support 1 on Chart), breaking this support level shall expose its next support level near 105.40(Its recent Low)


Wednesday, August 25, 2010

Good German IFO numbers and Poor US Housing data--- what will be the Impact on FX tradings ??

A good German IFO numbers has reduced the Selling pressure on Euros., 

The weak US Housing Data  will  boost the prospect of Further Easing Measures from  the Fed, resulting in the halting of Risk aversion in Dollars Trades, thereby limiting the growing strength of the Dollars.

And in my opinion, Strength of   Chf  and Cad and JPY will continue to being lifted higher near terms due to aggressive Risk Aversion. But CHF  may not be my  preferred trade due to imminent SNB's  intervention.  GBP may be lifted in tandem with the "feeling good " sentiments on Euros near term.

Gold will retest the 1240 resistance, and eying the 1270 near term


NZD/J and AUD/J  ,, -their downsides remain intact


USD/J  ----its downside remains 


U/CAD ---  is to test  1.2000 near term


GBP/U  -- may be retesting 1.5000 short term due to good sentiments on Gbp , coupling with good     German IFO data.


Euros/ Usd ---- may be trading in the range 1.2700- 1.2800 near terms

Monday, August 23, 2010

AUD CROSSES----WHERE WILL IT BE HEADING TO ??

A HUNG government ,  the  LIMBO  of  Government less Nation??  All investors don"t like upheaval and uncertainty.. And the chance of  Julia to form a coalition to rule is remote, thus paving ways for a new PM from Labour Party's  coalition .

The AUD/USD   has been  limited up to 0.9000 Maximum  before heading South few hours ago. Technically, this currency pair shall now retesting the immediate support at 0.8800 (Support 3 on Daily  chart),   Further down the road may expose a strong support near the Ichimoku cloud top / 50% Fibo ,  near 0.8750 /0.8740 region on Daily Chart.

Technicals show negative /bearish momentum for this currency pair.

Daily Chart  AUD/USD


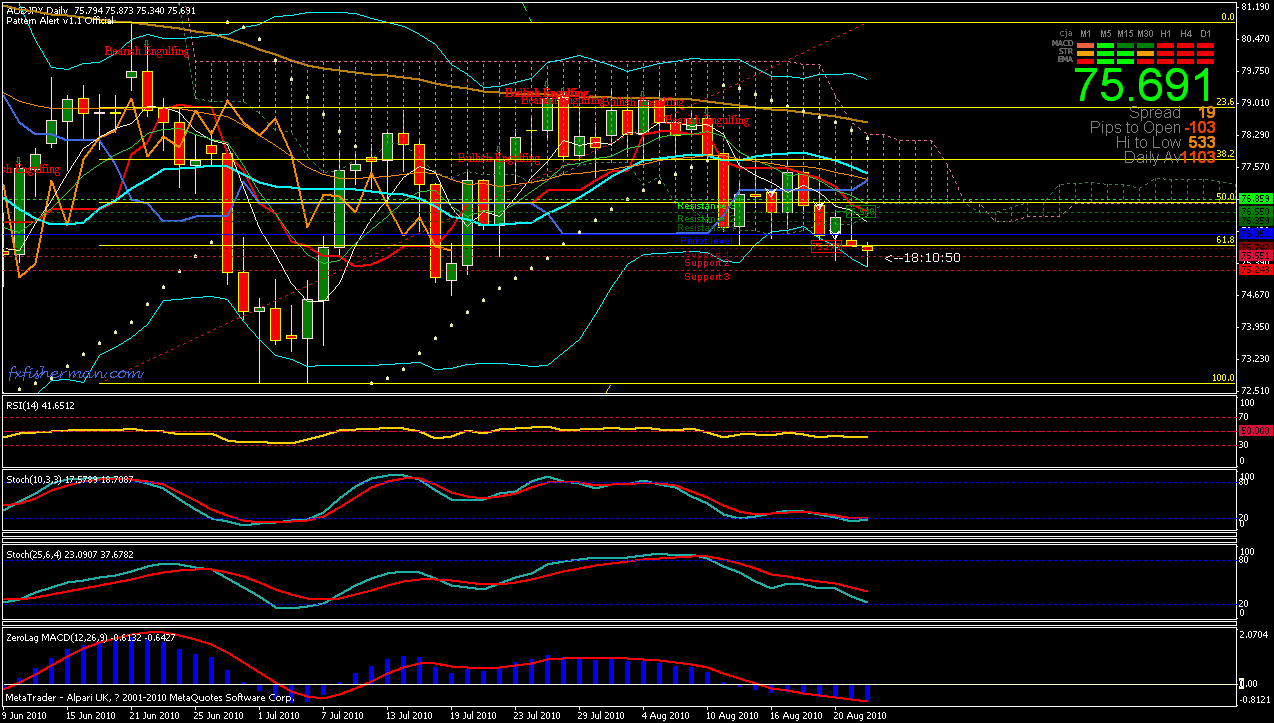
On AUD/JPY


In view of the imminent weakness of AUD  and the Strengthening Yen,  AUD/JPY shall test its immediate support near 75.20 (Support 3 on Daily Chart)
Successful breaching this support may expose this currency pair towards 72.65, being its recent Low.


Daily AUD/JPY chart


GBP/JPY --TO RETEST 126.50 NEAR TERM ??

The on-going strengthening of Yen , and the imminent weak Gbp near term may turn this currency pair to be the Star of FX 


H4 with longer term view 


H4 CHART


Daily Chart 


weekly chart 


Technical Analysis and trading Strategy


On H4, breaking 132.20 (Support 1 on H4) shall expose 131.92, (Support 2), also the (100.0 Fibo on H4).,,  FOLLOWS BY 131.39 being the support 3 on H4 CHART.
NOTE: 130.80 is the July low on 22-July 2020.


126.57 level is the   161.80 Fibo Extension on Daily Chart.


SELL Down this pair on any PULL BACK and to expect its next tp below 130.00 REGION near term, having the  possibility of further SOUTH thereafter to be below 126.00 .

Sunday, August 22, 2010

EUROS/USD-------Heading below 1.2000 soon ??

EURO/USD  drifted below its critical trend line and resistance supports near 1.2730  last week. Structurally, this currency PAIR  shall now regain its Bearish momentum and to retest its recent lows near term.  Please refer to my last week's postings on both the Fundamental and Technical Analysis on EURO/USD.


E/U DAILY  CHART 


E/U WEEKLY CHART


Technical Analysis/ Trading Strategy

On the Daily Chart, the imminent weakness of Euros shall send down this currency pair below 1.2600 (38.2% Fibo ) and the Ichimoku's cloud top support /resistance.

1.2423 is the next support (23.6% Fibo) ,which is also  near the Ichimoku Strong support(Cloud Bottom) on Daily chart..

Technically , this currency pair is extremely bearish, and the possibility of retesting its recent low below 1.2000 cannot be discarded near term..

YEN-----Will it be strengthening further ??

1) USD/YEN

U/J  H4 Chart 


U/J Daily Chart


U/J Weekly Chart


Technical Analysis

Usd/ Jpy moved between the  86.25  and its recent low 84.85 for almost 3/4 weeks on Daily Chart.

On H4, lifting this currency pair above 85.91 (Resistance 2 on H4) ) shall then retest the recent high 86.37. And only after Breaking this 86..37 will confirm its north bound journey above 87.44 (61.8% Fibo on Daily Chart)

On the Downside, going below the recent low 84.85 shall expose 80.55 (the 1.27 Fibo Ext.)


Trading Strategy

1) Open A Long(Buy ) PENDING order near 86.50 ( Just in Case the possible currency Intervention by BOJ   to stamp the rapid appreciation of the Yen)

2) Meanwhile looking for SELLING (Short) the currency pair with tight Stops  and Trailing Stops to take advantage of the persistent gaining of the YEN strength due to RISK  Aversion ( Please refer to my previous Fundamentals and Technical Analysis on Yen.)
SELLING down the pair on Next market's Asean session , wth target near 84.90 , but watch out for any sign of Currency Intervention from BOJ.