Welcome to my Trading Blog

Disclaimer: This is my personal Blog, reflecting my very own views on Forex , shares and commodity tradings. As such, all informations provided here are barely for information purposes only,. The author should not be held liable for any errors, incomplete information, delayed messages, or for any actions taken in reliance on information contained herein.This blog is new, being established on 06,May.2010. While I am executing trades, posting will be sent simultaneously. The date/Time indicated here is of US Pacific zone(++15 Hours for Singapore/KL/Beijing, Or ++7 hours GMT)

Sunday, October 17, 2010

Usd/Jpy---- will it reverse back toward 85.00 near term ??

Yen and Dollars are almost at their respective low interest (near 0%) in decades. . If any strong reversal is being effected on Dollars , then it may trigger the immediate BOJ currency intervention which may be extremely effective to further weaken the Yen .

The USD/YEN  has been lingering near the 81.00-82.00 over an extended period due to the imminent dollar weakness. And bearing in mind that Yen is excessively overbought for a long time.  Technically , it should be the right time for its reversal.

The reversal can be very violent (may exceed 300-500 pips ) within a short trading duration, As such, all Traders are reminded to be extra cautious on this possible abrupt reversal.

Any breaching over the level 82.90(61.8% Fibo Retr) will confirm its strong reversal, and follows by 84.26 (38.2% Fibo Retr), and then 86.35 (0.00% Fibo Retr)


USD/JPY Daily Chart 


Gbp/Usd ---will it breach 1.6500 near term ??

Sterling remains well bid on an otherwise data-free day to end a week in which the currency has fallen to a six-month low versus the euro. At the same time the unit has strengthened against the dollar to an eight-month high. Market stories suggest a large euro/sterling sell order connected to a company dividend payment is keeping the euro pinned down while bolstering the pound against the dollar at $1.6051. The euro buys 87.72 pence. The pound has performed well during the week despite signs that the labor market is losing steam while consumer confidence is also stalling. Next week the coalition government will unveil spending plans in an effort to reduce the sizeable budget deficit currently running at an equivalent 11% of GDP.

The Bank of England is likely to follow the US QE  PROGRAMME  despite the fact that inflation has now exceeded the official policy ceiling of 3% for seven months in a row now. Unlike that of the U.S., the British government is taking budget control rather seriously in progress austerity measures are likely to weigh heavily on the ability of the economy to weather the storm.Still, it’s hard to see how weaker economic activity ahead will permit inflation to remain as high. The pound rose against the dollar to $1.6098


Daily Chart  Gbp/Usd

H4 chart GBP/USD


H4 Chart with Ichimoku


The trend for GBP/USD is bullish in longer  term. Looking at the Daily Chart, wait for its retracement  near the support trendline(Red in Color), and to set up a Long trade for a possible 1.6105(0.00% Fibo Retr) and then follows by possible 1.6500 , (1.618 Fibo Extension)

On the H4 Chart with Ichimoku, we expect GBP/USD  to retrace near the Ichimoku Cloud top Resistance, near 1.5890, (or the 23,6 Fibo Retr), before it surges up toward the 1.6500 target on longer term.

AUD/USD--- to be capped near 1.0150 before plunging down ??

The Aussie rode the greenback’s weakness hard once again and the local dollar was inspired by a reading of consumer inflation expectations that appears to but the official 2-3% inflation range set by the RBA out of reach. The 3.8% reading of consumer price expectations from the Melbourne Institute for Social and Economic Research is unwelcome news for the central bank but for now having raised rates to 4.5% it can possibly be glossed over while the Federal Reserve determines how to stimulate the world’s largest economy.

. The ascent marks an eighth straight week of gains for the currency against the dollar but with the unit today trading at around 0.9995 . Nevertheless enthusiasm for the local dollar remains strong heading into the weekend. The Aussie remains underpinned by recent events in which a decline in the value of the greenback set against the background of advances in Asian demand has boosted the price the country achieves for its mineral and commodity exports. The tone remains buoyant with expectations of an imminent assault on the $1.00 mark. Lifting the Aud/usd currency pair beyond 1.0150 cannot be discarded near term.


Daily Chart AUD/USD

Aud/Usd H4 Chart

The AUD/USD currency pair is rather bullish near term, 

On the Daily Chart with trend line, the upper trend line(in red) and wave marked "5" may be crossed near 1.0150  maximum, prior to its  Bearish reversal 

On the H4 Chart, hitting below 0.9730 , being the Ichimoku Cloud Bottom Support ( also near the 23,6 %  Fibo Retr) will confirm its bearish reversal., with first Target being 0.9691 (0.00 % Fibo Retr) , follows by 0.9539(its recent low)

USD/CHF----when will it reverse back above 1.0000 ??

Weekly Chart USD/CHF


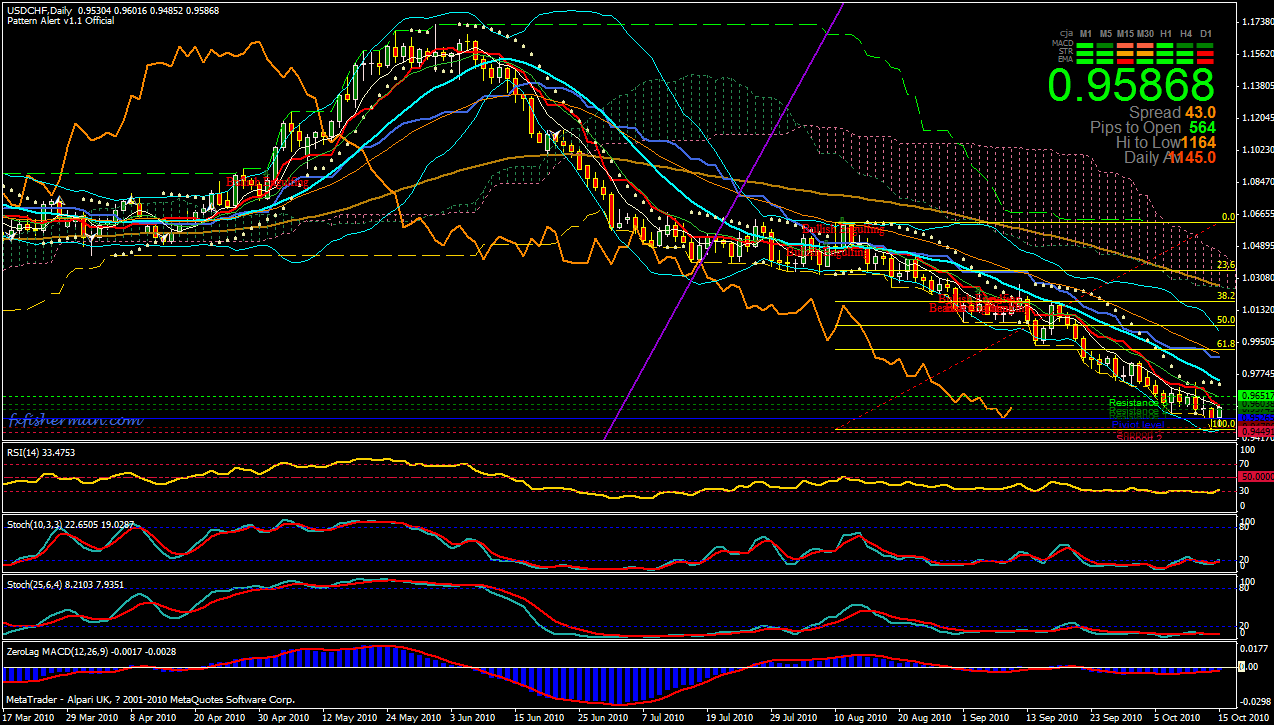
Daily Chart USD/CHF


USD/CHF has touched 0.9455 last week , indicating a bottom may have been attained,

On the Daily Chart, R3(Resistance ) is 0.96501, breaching this level and its next level 0.9721 (its next recent High as resistance), then REVERSAL is confirmed.

On the Weekly Chart, we note that  a Double Bottom/ Triple Bottom  pattern is being carved out, really for a Bullish reversal soon.

Usd/Cad------will it be back to 1.0600 level near term ??

Dealers continue to flock towards the Canadian dollar. Buoyed by rising commodity prices of its major exports, the loonie also finds favor from global central banks and governments as a solid bet. The Canadian government might well be the first amongst G7 governments to return to a balanced budget within five years. The Canadian unit stands at 99.88 U.S. cents having peered through parity earlier to reach $1.0005 cents. The unit has taken just about six months to cross its own little line in the sand against the greenback.

Subdued inflationary pressures would confirm the market’s doubts that the Bank of Canada would be willing to continue the campaign of interest rate hikes for the rest of the year. The inflation gauge could see a small increase by 0.1% m/m, compared with the 0.1% m/m decline in the previous month.

If the expected Dollars reversal is in place in upcoming week, then the bullish USD/CAD  can be expected. 


Daily Usd/Cad Chart 


The usd/cad is expected to be capped near 0.9930-0.9950. A breaching of the 1.0150 (Marked in red line) will confirm its reversal toward 1.0600 level.

NZD/USD ---will it hit beyond 0.8000 near term ??

Rising inflationary pressures could improve the odds of a rate hike as early as the Reserve Bank of New Zealand’s next meeting on October 28, especially if the inflation gauge registers a larger than the 0.3% q/q increase in the previous quarter. 

 Her neighbor Autralian Aud  is now heading toward Parity vs the Dollars, lifting Nzd//Usd to the next higher level., As the AUD/USD is limited on the upside, but potential for NZD/USD remains to be a better bet near 0.8000 level


Daily Chart on NZD/USD 


The Chart above indicates  that the a-b-c of the pattern,  And location of C , if extended with the upper trendline, it will be almost  CROSSED near 0.8000. The indicators are bullish near term.

Sunday, October 10, 2010

USD/CAD ---Will it breach 0.9900 near term ??

The imminent weakness of Dollars and the relatively good commodity prices including Crude shall push this currency pair  USD/CAD  down to below parity near term.

Looking at the Daily chart with trend lines, we observe that the Triple -Tops pattern have been formed  and all the Bearish divergence indicators are pointing toward below Parity near term.

The Resistance is near 1.0360(50% Fibo), and strong support is at 0.9900( Its recent Low) .


Daily Chart on USD/CAD showing the Triple-Tops 

GOLD---will it hit 1400.00 near term or going below 1300.00 ??

Euro’s test of the 1.40 level against the U.S. dollar will be used as a trigger to trim positions. Drastic moves typically signal the end of a rally as the final skeptics and last buyers try to hop on a trend, so Last Tuesday and Wednesday’s moves put me on alert. and Thursday Bearish Engulfing Candles signalling reversal may be imminent,  I am now expecting some kind of correction that will cool things off and provide the next buyable dip


Gold may still be lifted possible near 1400 before plunging down, as 1400 is the 100% extension from 1048-1270 advance., but only below 1320 will confirm the Bearish reversal.


As the Dollars weakness may persist much longer, the breaching  of level 1400  can not be discarded. Euro/usd may be traded within a close range from 1.3950-1.1450  near term, and resulting in  Gold  to be in Bearish reversal as Investors may view Gold as Bubbles for prices beyond 1400.


Daily chart for Gold with Trendlines and support /resistance


USD/CHF---WILL IT GO BELOW 0.9400 NEAR TERM ??

The good fundamentals and safe heaven status of Swiss France shall propel  USD/CHF further down towards 0.9400, and the possibility of breaching 0.9000 cannot be  discarded due to the persistent weakness of Dollars near term.

Its strong support is thus near 0.9400, breaching this level may expose 0.9000., And its strong resistance is near parity, 1.0000 level.


Monthly Chart on USD/CHF


EURO/USD--- will it breach 1.4500 near term ??

The news on currency wars has picked up lately as the Federal Reservehas promised to LOAD DOWN  more dollars on the American economy (confirmed by subsequent statements from Fed members). meaning the much anticipated Stimulus plan is on schedule. The Downward Pressure on the devaluation of Dollars are ever increasing.


And Goldman Sachs has downsized the EURO/USD to 1.5000 near term, due to the extreme weakness of Dollars.


Further to the ECB maintaining the interest at 1.00% unchanged, now Euros seems to be the only HERO  (As BOJ has further reduced her Interest near 0.00%).


So,  I expect the EURO/USD to breach R3 (1.41106) on WEEKLY Chart near term , and then looking at 1.4370, (being the 23.6% Fibo),  follows by 1.5139 (0.00% Fibo)


Weekly Chart on EURO/USD


USD/YEN---Will it go below 80.00 near term ??

BoJ may have to step up its intervention and use of its newly announced easing weapons on Nov 2 to counter the negative USDX effect from the FOMC decision


However, the recent poor NFP report has forced USD/YEN pair  to be weakened  further  near 81.72.


Now BOJ has turned Yen into a practically free interest currency, whereby it poses further problems and ineffectiveness on Currency Intervention, 


As such, I still foresee and expect Usd/Yen to go down below 80.00 near term, and Further downside near 72.00--75.00 region cannot be discarded by end of this 4th Quarter .


Weekly Chart on USD/YEN with bearish divergence


Monthly Chart on USD/YEN  with bearish divergence


GBP/USD , TO retest 1.7000 NEAR-TERM ??

Technically,GBP/USD is Bullish near term, heading toward the Strong Resistance at 1.6022 on the Daily Chart.

If the resistance at 1.6022 is breached, on the WEEKLY Chart,  then next target will be 1.6250(23.6 %  Fibo),  Follows by 1.6870 (0.00%  Fibo ), All indicators are pointing Bullishness  for this currency pair.


Daily Chart on GBP/USD , showing its strong resistance near 1.6022


Weekly Chart on GBP/USD, showing the multiple trend lines with possible lift towards 1.7000


Weekly Chart on GBP/USD, showing its various Fibo Resistance/Supports

NZD/USD ----WILL it breach 0.8000 near-term ??

Fundamentally, NZD looks promising  as Aud /Usd  may be capped near 1.0000 near-term.

By recognizing what is going on as a currency war, US and Europe can therefore call for a truce. The basis for the truce is some sort of agreement on Asian currency appreciation. Making it a regional issue avoids singling China out. Moreover, given the significance of intra-regional trade, getting an regional agreement may avoid a change in relative competitiveness within Asia. Yet the chances for such an agreement seem slim, and arguably too slim to justify risking the unleashing of protectionist retaliation in the so-called war.


We will now get the clues from the Weekly chart on Aud/Nzd,  It is now showing a beautiful Double Tops Formation.  It means a high potential for further strengthening of NZD.


Note: The Aud/Usd  will be retesting 1.000 , which is rather limited upside with another possible lift near 1.0150.


Back to the NZD/USD, On the Daily  chart with Ichimoku, We observe that the Bullish Divergence on both RSI and MACD shall propel this currency pair towards R3, , or 0.7640 near term, then 0.8000 of the Psychological resistance next.


Weekly chart on AUD/NZD , showing Double Top (For Bullish NZD)


Daily Chart on NZD/USD , showing Bullish Divergence 


Sunday, September 26, 2010

FOMC meeting-- -How does it affect the Entire World Markets ??

1) On Global Equities

As imminent devaluation of Dollars on sight due to another possible one Trillions stimulus plan, so another Rally on World Equities due to the Liquidity-fed Markets cannot be discarded. All cash will rush into Equities

In Short, even though the U.S. economy remains weak, there are still improvements taking place, albeit very modest. Additionally, market participants are taking some solace in the fact that despite the weakness, the indicators are not showing an economy on the brink of collapsing, if the U.S. economy shows signs of improvement, stocks' prices would rise. Additionally, if the Federal Reserve were to add more stimuli to the economy, stocks would still rise.


2) On Commodities
The devalued Dollars will further feed the demand for Hard Assets. Gold and Silver will be lifted to another historical high (Gold may hit 1350-1400, and silver may breach 25.00)
Crude oil will also break through multi-week resistance despite the highest ever recorded US inventories (Crude may retest 79.00--80.00 level near term)


Gold is a currency hedge priced in US dollars and thus its rise suggests fear of loss of value of the USD. US Treasury bonds are a safe-haven asset and partial bet on the USD as a store of value, and hedge against riskier assets like stocks.The two move in opposite directions. Either the USD is in trouble and gold should be higher, or Treasuries are the right bet and gold should be lower. Over time, one of these trends must reverse.
Crude oil prices, which have been shadowing the equity markets for some time now, followed accordingly and traded to the upper end of its trading range. Nonetheless, investors remain cognizant of the fact that inventories are at the highest levels seen in about 30 years. By and large, the technical resistance point for oil appears to be the $76 per barrel area.


3)  Forex


The further weakening of the Dollars will drive the USD index to its lowest level in months, and the possibility of retesting its Low near 74.20 ( recorded on NOV,2009)  is possible near term, with predictable results.
  • The USD was the last week’s weakest currency
  • The EUR was the strongest, despite news of deteriorating PIIGS bond prices and EU growth which together at other times could have put the EUR at the bottom of the weekly forex pile.
  • The move virtually wiped out the nascent downtrend in the USDJPY that the Bank of Japan has been trying so hard to engineer.


UP-COMING WEEK


US stimulus cash is more likely to wind up fueling emerging market growth as US companies deploy the cheap cash to markets with lower labor costs and faster consumer spending growth rates.
While it’s questionable whether the Fed can truly prevent future inflation by sopping up excess liquidity at just the right time, it certainly risks further loss of confidence in the USD and thus America’s ability to continue selling bonds at such low rates. That would be a greater problem, given America’s dependence on its bond sales to fund its own operations. With debt levels already at 93% of GDP, even a small increase in borrowing costs could become a crippling burden.


Is the Weakness in Euros imminent ?

Last week, the strong Euros was actually driven by the relatively weakened Dollars, not caused by Any Fundamental improvements.
In fact the week’s news was mostly negative for the EUR with rising PIIGS bond/CDS rates, Irish banking trouble, lackluster manufacturing and services PMIs. Thus as long as the two most widely held currencies fundamentally weakening, anything seen as a currency hedge with decent fundamentals like precious metals or grains/ coffee/ cotton  are  benefiting.


Will  EUROS/USD  reverse, and retest 1.3000 in upcoming week ??


There is plenty of potential for a reversal lower with the EUR.
  • As noted above, most of the EUR gains are from USD weakness, which was likely overdone last week.
  • PIIGS bond sales went off but were at high rates and even those ‘successes’ may turn out to be from ECB purchases.
  • Spain will try to pass new austerity measures in the coming week. The last one passed by only one vote.
  • Recent data suggest EU growth may be slowing. If the EU growth advantage is seen as fading, so will the EURUSD.

Note: 


EU Sovereign Debt/Banking Crisis: Unlikely to spark more than short term drops as long as ECB can continue to ‘manage’ PIIGS bond auctions so that they succeed, and the focus remains on weak US data rather than on weak EU data.


The big question is, how long can the ECB continue to buy PIIGS bonds to keep auctions successful without its own new QE, and concomitant hit to the EUR?
Again, ratification of new Spanish austerity measures could be the next EU crisis eruption, as it could raise questions about long term commitments to austerity elsewhere in the EU as well as in Spain.


On GBP/USD  outlook , it may retest 1.5450  near term ??


Further Evidence of UK Weakness Could Pressure GBP
Recent UK data has been weak and MPC minutes suggest openness to more QE, even as a BoE economist stated that if inflation becomes a problem an aggressive rate hike may be forthcoming. We believe the UK, like most democracies, will risk inflation over another recession.


ON YEN MOVEMENTS 
Currency intervention will remain front and center, along with tensions with China in the East China Sea. In addition, Japan will release its Tankan report on UPCOMING Wednesday, which, while usually a highlight in the region, the latest survey of thousands of companies that goes into the Tankan results were made before the Bank of Japan launched its currency intervention, so the results could be viewed by market participants as somewhat 'stale'.


We may see USD/JPY  retest 82.00 near term.
As such, we must be careful on trading the YEN crosses in upcoming week due to the likelihood of further Currency intervention by BOJ.


Conclusion

The overall tone of markets in upcoming weeks  months will be  marked more by 'choppiness' than by any smooth trend. In such conditions, examining the market's response to data and discriminating between "over-reactions" vs "game-changers" is even more challenging, but vital.

As always, each investor will weigh the set of data that he/she finds most compelling and will decide appropriate investment responses based on his/her unique financial profile and risk tolerance. 

Happy trading