Welcome to my Trading Blog

Disclaimer: This is my personal Blog, reflecting my very own views on Forex , shares and commodity tradings. As such, all informations provided here are barely for information purposes only,. The author should not be held liable for any errors, incomplete information, delayed messages, or for any actions taken in reliance on information contained herein.This blog is new, being established on 06,May.2010. While I am executing trades, posting will be sent simultaneously. The date/Time indicated here is of US Pacific zone(++15 Hours for Singapore/KL/Beijing, Or ++7 hours GMT)

Monday, August 30, 2010

EURO/USD-------TO BE SETTLED NEAR 1.25000 NEAR TERM ??

EURO/USD H4 with Ichimoku Chart


Daily Chart


Trading Analysis


Fed  Bernankes speech highlighted 2 key points; purchases of long term assets are his favourite option for additional easing; and the central bank will not breach its commitment to price stability. The preference of additional asset purchases over communicating a longer period of exceptionally low rates and reducing interest rate on reserves allow for the possibility of renewed expansion of the Feds balance sheet. I therefore envisage that  there  was  NO REASON for USD to rise when Bernanke keeps the door open for QE(That means printing more Dollars via printing presses)


On H4, we observe that for the past 14 trading days, this currency pair moved within the range 1.2850-1.2600 for the past 12 Trading Days.


On the Downside, on H4 with Ichimoku chart , ITS IMMEDIATE SUPPORT IS SUPPORT 2, at  1.2675. Breaking this level may send this pair down to its next support near 1.2590, its recent low, follows by 1.2431.(61.8% Fibo)


On the upside, successful breaching the 1.2850 ,its 38.2% Fibo, also near the Ichimoku Cloud Top Resistance(on H4)., may resume its reversal toward the 1.3000 level. 


This currency pair now is negatively biased /with bearish sentiments.But upside should be limited by 1.3000 resistance and bring fall resumption. Below 1.2600 will target 61.8% retracement of 1.1875 to 1.3330 at 1.2431 next. 


Further down the road may send this pair to retest the 1.2000 level( 61.8% Fibo between 1.6040 to 0.8223, on a much longer prospectives) 

Sunday, August 29, 2010

AUD/USD----WHEN WILL IT BE GOING BELOW 85.00 ??

AUD/USD


H4 with Ichimoku Chart


H4 with ab-cd movements colored in Purple with potential Double Tops

Trading Analysis


On the H4 Chart with ab-cd movements completion drawn, you may note that there is a completion of Double Tops being capped at 0.9050  on the H4 chart. The PA is now ripe for rapid descent, coupling with bearish sentiments.


On the H4 with Ichimoku Chart,, 0.8940 is its next immediate support, being the Ichimoku Cloud Tops support, near the 38.2% Fibo, Breaking this support may expose its next support near 0.8875(61.8% Fibo) , and 0.8769 next, (being the recent low)

U/CAD-------WILL ITS NEXT TARGET BE 1.0000 ??

We observe the consolidation of U/CAD last week, and on  daily Chart, we can see the completion of ab-cd movements which are colored in Purple. If you observe the attached Daily Chart, you may spot the completion of Double/ Triple Tops,, resulting  the PA on its Bearish descent near term.
The recent recovery of Crude oil price may lift this currency pair much faster in its descent.


H4 with Ichimoku Chart


Daily Chart with ab-cd movements and Double/Triple Tops


Trading Analysis.


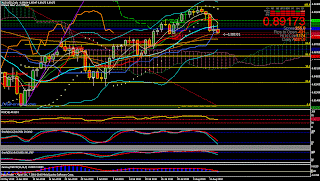
On H4 Chart with Ichimoku, Bearish Sentiments shall send this pair towards the 1.0400 (Support 3, or 38.2 Fibo% Fibo) , also near the Ichimoku Cloud Bottom support on H4.,. Below this important support shall expose 1.0345( 23.6% Fibo),follows by 1.0246 (Its recent low)

On Daily Chart, as ststed above, Both the completion of ab-cd movements and Double/Triple Tops shall further enhance its Bearish downward movement near term.. And the possibility of retesting its PARITY cannot be discarded.

YEN Crosses --what will be the Direction after rumors on Further Liquidity Easing Measures and Various BOJ Potential Actions?

Yen is still considered a Safe Heaven Currency irrespective whatever actions are to be taken by BOJ.
Last FRIDAY's YEN SELL-OFF was INITIALLY TRIGGERED by a Nikkei News report (early Saturday edition), stating the BoJ may move forward its September 6-7 meeting to next week. However, towards the London's Close, the weakening Dollars fueled the SELLING of Yen.


The early Monday  Asean trading session with  Bullish sentiments on Asian Equity has stamped the selling
 Pressure on the  Yen which shall now to be ON HIS USUAL Strengthening course 

The Further confirmation on the Easing Measures to be implemented by BOJ shall further Lift the Yen due to Risk Aversion.


1) USD/JPY


H4 with Ichimoku Chart


H4 with ab-cd Chart


Trading Analysis.


On the H4 chart with ab-cd completion drawn in Purple color, we expect the down-trend shall continue near term.
The Bearish divergence with negative sentiments shall drive this currency Pair towards the 84.24 ( Support 2, near the 23.8%  Fibo Retr), , below this level may expose 83.60 (its recent Low)


On H4 with Ichimoku chart, 85.00 is the Tenkan-Sen support, Going Below this Point shall drive down rapidly its next support level  at  84.50.


On the Upside,  PA breaching the 87.00 (50% Fibo level) will confirm its Bullish Reversal.


2)  EURO/ JPY


H4 with Ichimoku Chart


Daily with ab-cd Chart


Trading Analysis


On the H4 with completion of ab-cd which are colored in purple,, we expect the PA shall now be going down after minor  PULL back last Friday.The sentiments are bearish/negative biased.. Next Support at 107.02 (just below  the 61.80%Fibo) shall be tested soon, breaking it may expose 105.40 next


On H4 Chart with Ichimoku, we do note that 107.50 is a strong Tikun-sen support (Support 1 on Chart), breaking this support level shall expose its next support level near 105.40(Its recent Low)


Wednesday, August 25, 2010

Good German IFO numbers and Poor US Housing data--- what will be the Impact on FX tradings ??

A good German IFO numbers has reduced the Selling pressure on Euros., 

The weak US Housing Data  will  boost the prospect of Further Easing Measures from  the Fed, resulting in the halting of Risk aversion in Dollars Trades, thereby limiting the growing strength of the Dollars.

And in my opinion, Strength of   Chf  and Cad and JPY will continue to being lifted higher near terms due to aggressive Risk Aversion. But CHF  may not be my  preferred trade due to imminent SNB's  intervention.  GBP may be lifted in tandem with the "feeling good " sentiments on Euros near term.

Gold will retest the 1240 resistance, and eying the 1270 near term


NZD/J and AUD/J  ,, -their downsides remain intact


USD/J  ----its downside remains 


U/CAD ---  is to test  1.2000 near term


GBP/U  -- may be retesting 1.5000 short term due to good sentiments on Gbp , coupling with good     German IFO data.


Euros/ Usd ---- may be trading in the range 1.2700- 1.2800 near terms

Monday, August 23, 2010

AUD CROSSES----WHERE WILL IT BE HEADING TO ??

A HUNG government ,  the  LIMBO  of  Government less Nation??  All investors don"t like upheaval and uncertainty.. And the chance of  Julia to form a coalition to rule is remote, thus paving ways for a new PM from Labour Party's  coalition .

The AUD/USD   has been  limited up to 0.9000 Maximum  before heading South few hours ago. Technically, this currency pair shall now retesting the immediate support at 0.8800 (Support 3 on Daily  chart),   Further down the road may expose a strong support near the Ichimoku cloud top / 50% Fibo ,  near 0.8750 /0.8740 region on Daily Chart.

Technicals show negative /bearish momentum for this currency pair.

Daily Chart  AUD/USD


On AUD/JPY


In view of the imminent weakness of AUD  and the Strengthening Yen,  AUD/JPY shall test its immediate support near 75.20 (Support 3 on Daily Chart)
Successful breaching this support may expose this currency pair towards 72.65, being its recent Low.


Daily AUD/JPY chart


GBP/JPY --TO RETEST 126.50 NEAR TERM ??

The on-going strengthening of Yen , and the imminent weak Gbp near term may turn this currency pair to be the Star of FX 


H4 with longer term view 


H4 CHART


Daily Chart 


weekly chart 


Technical Analysis and trading Strategy


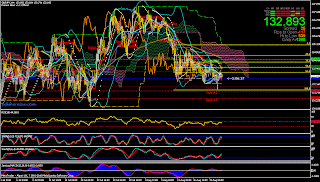
On H4, breaking 132.20 (Support 1 on H4) shall expose 131.92, (Support 2), also the (100.0 Fibo on H4).,,  FOLLOWS BY 131.39 being the support 3 on H4 CHART.
NOTE: 130.80 is the July low on 22-July 2020.


126.57 level is the   161.80 Fibo Extension on Daily Chart.


SELL Down this pair on any PULL BACK and to expect its next tp below 130.00 REGION near term, having the  possibility of further SOUTH thereafter to be below 126.00 .

Sunday, August 22, 2010

EUROS/USD-------Heading below 1.2000 soon ??

EURO/USD  drifted below its critical trend line and resistance supports near 1.2730  last week. Structurally, this currency PAIR  shall now regain its Bearish momentum and to retest its recent lows near term.  Please refer to my last week's postings on both the Fundamental and Technical Analysis on EURO/USD.


E/U DAILY  CHART 


E/U WEEKLY CHART


Technical Analysis/ Trading Strategy

On the Daily Chart, the imminent weakness of Euros shall send down this currency pair below 1.2600 (38.2% Fibo ) and the Ichimoku's cloud top support /resistance.

1.2423 is the next support (23.6% Fibo) ,which is also  near the Ichimoku Strong support(Cloud Bottom) on Daily chart..

Technically , this currency pair is extremely bearish, and the possibility of retesting its recent low below 1.2000 cannot be discarded near term..

YEN-----Will it be strengthening further ??

1) USD/YEN

U/J  H4 Chart 


U/J Daily Chart


U/J Weekly Chart


Technical Analysis

Usd/ Jpy moved between the  86.25  and its recent low 84.85 for almost 3/4 weeks on Daily Chart.

On H4, lifting this currency pair above 85.91 (Resistance 2 on H4) ) shall then retest the recent high 86.37. And only after Breaking this 86..37 will confirm its north bound journey above 87.44 (61.8% Fibo on Daily Chart)

On the Downside, going below the recent low 84.85 shall expose 80.55 (the 1.27 Fibo Ext.)


Trading Strategy

1) Open A Long(Buy ) PENDING order near 86.50 ( Just in Case the possible currency Intervention by BOJ   to stamp the rapid appreciation of the Yen)

2) Meanwhile looking for SELLING (Short) the currency pair with tight Stops  and Trailing Stops to take advantage of the persistent gaining of the YEN strength due to RISK  Aversion ( Please refer to my previous Fundamentals and Technical Analysis on Yen.)
SELLING down the pair on Next market's Asean session , wth target near 84.90 , but watch out for any sign of Currency Intervention from BOJ.

EURO/JPY--- TO DRIFT BELOW 100.00 NEAR TERM ??

The imminent weakness and Strengthening Yen has enhanced the possibility of  hitting 100.00 level  for EURO/JPY  near term. Please refer to my  previous postings on Fundamental and Technical Analysis on YEN and Euros.

E/J H4 CHART 


E/J DAILY CHART

E/J WEEKLY CHART


Technical Analysis and Trading Strategy


On Daily chart, its next support 108.05 (Support 2 on Daily Chart) looks vulnerable, and its next support near 107.53 (Support 3 on Daily chart ), or its 1.2700 Fibo Extension near 107.73 are two CRITICAL SUPPORT LEVELS.
Breaching convincingly 107.50 shall send this currency towards it psychological  100.00 level near term ( Please do note that 88.78 is the low in October, 2000)
NOTE: Current technicals look extreme Bearish for this currency pair.


SELL DOWN THIS CURRENCY PAIR with tight stops /Trailing Stops (Just be cautious on the possible currency intervention from BOJ)


On the Upside, On H4, LIFTING ABOVE 109.92 resistance (61.8% Fibo), shall expose 110.40 ( 50% Fibo retr), also near the Ichimoku cloud bottom resistance. 
111.55 shall be capped near term (Ichimoku top cloud resistance )and also near the 23.8% Fibo Retr. during  Reversal.

USD/CHF-- A new target to below 1.000 ??

Swiss Franc  continues  its strengthening process due to both good Fundamentals and Risk Aversion activities. .And the possibility of reaching parity near terms remains to be EXTREMELY HIGH.


U/CHF H4 CHART


U/CHF weekly chart


TECHNICAL ANALYSIS AND TRADING STRATEGY


On H4, drifting below the Tenkan-sen level near 1.0325 shall see this currency pair retesting 1.0298 (support 1 on H4) and 1.0272(support 2 on H4) subsequently.


Breaching the above stated supporting levels will send this currency pair below parity near term .
Currently, H4, DAILY and  WEEKLY CHARTS all show bearish with negative-biased sentiments.


Sell down this currency pair on any noted PULL Back opportunities.

USD/CAD---TO RETEST 1.2000 NEAR TERM ??

Technically, on both H4 and Daily charts, this currency pair shows the bearish sentiments with negative momentum.

H1 U/CAD Chart


DAILY CHART


Technical Analysis


On H4, we may note that there is  a Double Top formation, now awaiting for the bearish downtrend  to commence. 
1.0410  support is the 61.8% Fibo Retr, which is also near the Ichimoku Cloud top support on H4.


Successful breaching the above level shall expose the next strong support at 1.0300, which is the Ichimoku bottom Cloud support and it is also near the 23.8% Fibo Retr..,   And further downside  may see the 1.2500 (its recent low), follows by 1.0000 next.


So SELL down this currency pair on further extension  near 1.0515--1.0500, for a huge downside potential near term.

Sunday, August 15, 2010

EURO/USD -----going below 1.2500 soon??

The Fed decided to increase the demand for dollars without investing in the economy. This is extremely bearish for the velocity of dollars. It seems most bullish for any currency more fundamentally strong than the dollar, such as Swiss Franc AND gold/ Silver.


Tensions are worsen in the European bond markets. The Greek-German spread has widened back out to 800 bp, the widest in several weeks. Spain, Portugal and Italian spreads are wider too. Irish 10-year bond yields have risen 42 bp this week are up a single basis point today. German bonds recovered from initial losses sparked by the best GDP in 20-years (2.2% quarter-over-quarter) with stocks coming off, tensions rising and the euro reversal. US Treasuries remain well bid, including the 30-year bond, with yields 2-3 bp lower.


Europe's financial challenges have not been resolved, despite the euro’s recent recovery. Its bluff is more likely to be called in a weak growth and low risk tolerance environment.


The US now experiencing slower growth than in Q4 09 and Q1 10 


The “equilibrium” rate for the euro-dollar exchange rate, WHICH IS OF EVERY BODY ' GUESS, while probably a bit higher now than it was six months ago, may still be below prevailing levels.


Daily Chart


H4 Chart


H1 Chart


TECHNICAL analysis


On Daily chart, the current bearish sentiments may retest the bottom trend line near 1.2730,. which if being broken, it may send the currency pair toward the 1.2600 (50% Fibo) , follows by 1.2440 (38.2% Fibo)


On the daily chart with Ichimoku, we note that the immediate support is near 1.2615, being the Ichimoku cloud's Top, follows by the next support at the Ichimoku cloud bottom near 1.2350-1.2360.


However, we do note that on H1, H4, Daily Charts, there is a significant loss of Downward momentum from the MACD/RSI/STOCHASTIC,, Signalling that further downside drift may be limited.


On the Up side, on H1, successful lifting of the PA above the Tenkan-sen near 1.2773 , and Kijun-sen NEAR 1.2815 (It is also near the 50% Fibo) shall expose this currency pair retesting the 1.2845 , being the Ichimoku cloud's  bottom resistance and close to its daily pivot line. Technically, 1.3000 can be a very strong resistance .


AUD/USD-----GOING DOWN TO 85.00 SOON ??

The Aussie was also tripped up by dashed hopes surrounding Japanese currency intervention.
Risk appetite was suddenly back on the table and the Aussie spiked higher to reach 90.35,The Aussie has since recovered to stand at 89.73  and at this price will close at its first weekly loss in three against the dollar LAST WEEK.


Economists were predicting a 20,000 overall employment gain while data for June was revised to the downside. Some investors used the report to poke holes in the string of six-quarter point rate increases at the RBA suggesting that its action was too much at a time when U.S. growth was naturally coming off the boil.


Daily Chart


H4 CHART


TECHNICAL ANALYSIS


On H4, support 3 AT 0.8837 LOOKS VULNERABLE, WITH EXTREME BEARISH SENTIMENTS.


On daily chart, the next immediate support o.8704, being the Ichimoku cloud's top and near 50% Fibo. , Breaking this critical support will expose 0.8437 (23.6 Fibo)


The current sentiments on this currency pair ARE extremely BEARISH

USD/JPY----------going down to 80.00 soon ??

The current vacillations of the Yen are dependent on whether BOJ dare to intervene to curtain the Yen's strength due to Risk Aversion.
Inevitably, official intervention becomes a Red Flag to Bulls wanting to test the possible coordinated intervention.
The Yen is lower against all but the Euro, as intervention speculation is beginning to heat up. In addition, the Nikkei closed higher overnight, after experiencing a few days of losses. 
Japanese GDP figures are due out at the beginning of next week, and if they come in weaker, could induce more speculation of currency intervention.


H4 USD/JPY


Daily USD/JPY

Weekly USD/JPY


TECHNICAL ANALYSIS

On H4, We observe that the PA tried to break the resistance near 86.20 three times but failed., Signalling a high probability to roll over from here towards its next lower target soon.

On weekly chart, 84.82 seems to be a strong support, breaching it successfully shall send this pair to roll over towards the 80.55 which is the 1,270 Fibo Extension level.

Thursday, August 12, 2010

EURO/USD---Why does it go bearish after FOMC meeting ??

FOMC   and  FED  decided  to buy more treasuries and  reinvest principle payments on mortgage assets and maturing debts have resulted in the High demand for dollarsIMMEDIATE dropping of  equity( S & P 500/ FTSE) , upsurging in gold , strengthened Dollars and  YEN,  accompanied by selling off  of  Commodity Currencies( AUD/U,  NZD/U, U/CAD, AUD/J, CAD/J, AUD/J, NZD/J) due to the concern on slowing China Economy,( CHINA  July Industrial production slowed to 13.4% y/y from 13.7%, retail sales slowed to 17.9% y/y from 18.3%, CPI rose to 3.3% from 2.9% mainly on flood and weather impact)


Despite the lowered growth prospects for the US, it is again gaining safe haven status. Yields on today's auction of $24B 10 year Treasury notes was down to 2.71%, the lowest since early 2009, as money seeks safety in the Treasury coffers.


The strength of both Dollars and YEN  benefited after the further downgrading of US economy by  Feds   herself  with further signs of a slowing China Economy( Which is of severe impact) weighed significantly on the risk trade ,, as Investors are now considering the two (Yen and Dollars) are the  safe heavens  as the equity markets sunk below its three months low.


This is another typical example on CARRY TRADE UNWINDING.


Further Analysis on Euros/Usd


Daily Chart E/U


Weekly Chart E/U


On the Daily chart,  the breaking of support at 1.2732 (support 2) shall expose 1.2600 , near the 50% Fibo retr and also close to the Ichimoku top cloud support  which is considered a very critical supporting level. The entire bearish reversal is confirmed upon breaching this 1.2600 level.


However, successful lifting of the pair at 1.3040 on daily chart (near both Tenkan-sen and kijun line resistance on daily chart )  will resume its upward bullish reversal action.


All H4, Daily, and Weekly Charts show extreme bearish in the next few trading sessions.


In short, Euro/Usd must hold above 1.2732 to prevent severe damage below the 1.2500 level

Sunday, August 8, 2010

EURO/USD --- to breach 1.3500 near term ??

Negative NFP report released last Friday further weakened the Dollars and sent the currency pair hitting 1.3333

Further Easing measures from Fed  and FED's  downward forecasts and unusually uncertain view at the expense of prolonged downside in bond yields and USD SHALL send this currency retesting 1.3333 and reaching further North this upcoming week.


one of the main drivers of USD weakness since the beginning of June has been a widening in interest rate spreads against the USD relative to other major currencies, especially in EUR/USD. EUR rates increased as markets priced-in the withdrawal of ECB long-term lending facilities and convulsed through the European sovereign debt crisis. US short-term rates also moved modestly lower as incoming data painted a weak outlook.


Those spreads have stopped widening (from about -2 bps at the end of May to a peak at -50 bps at the end of July; last at -44.5 bps) and there is reason to believe they may begin to narrow in the weeks ahead, potentially signaling a medium-term top for EURUSD.


Technical Analysis


H4 E/U Chart


Daily E/U Chart 


On the H4, Resistance 2 (1.3363 ) is a critical Resistance level. The present bullish-biased trend shall send it towards next resistance 1.3511 which will be the 50% Fibo Retr.


On the Daily Chart, we do note that the next resistance is 1.3428, breaking it may expose  the 1.3511. But please do note that negative divergence are observed on both the MACD and Slow Stochastic (10,3,3), We must monitor closely the presence of any divergence , if any, on both the Fast Stochastic and RSI near term.


In short, the northern Journey for Euro/Usd may continue towards 1.3500 region but please watch out for pull back near 1.3400--1.3600.

USD/CHF ---- will it breach 1.0000 soon ??

USD/CHF shall retest its last Friday low at 1.3333 . Further strengthening of Swiss Franc is expected being in tandem with  the rising strength of Euros near term.

Extreme bearish sentiments are observed on H1/H4/DAILY/WEEKLY  Charts .

Daily/ Chf  Chart


Weekly USD /CHF Chart


On the Daily Chart, resistance 1 , being 1.0473  can be the critical  level for possible  reversal.

On weekly Chart, its next support is at 1.0290(Support 2), follow by 1.0220 (Support 3) , and breaking these two supports  may send this currency pair towards Parity. 

AUD/USD----- When will it be back below 0.8900 ?

Aud/ Usd is a very interesting pair which has maintained its strength for prolonged period partially due to the weakness in the Dollars recently.


H4 AUD/USD Chart


Daily Chart AUD/USD


Weekly Chart AUD/USD


On the Daily Chart, we can see that resistance 1  at 0.9184  is a very important Resistance/Suppport.  The possibility of  breaching 0.9261, being the Resistance 3 on the daily chart cannot be discarded.

However, the presence of  bearish sentiments on H1/H4/Daily charts are signalling us that the reversal may be on sight near term.

On H4, the next immediate support is 0.9096 (61.8% Fibo Retr), breaking it may expose 0.9022, and 0.8976 (being 38.2% and 23.6% Fibo Retr  Respectively), and then  0.8900 (0.00 Fibo Retr)

Please do note the formation of  Bearish triple tops on weekly charts is being finalised soon

In short, AUD/USD may reverse and dip below 0.8900 soon.